
Trusted by 15000+ Users
Seasonal Opportunities
Identify the top 5 seasonal opportunities every day
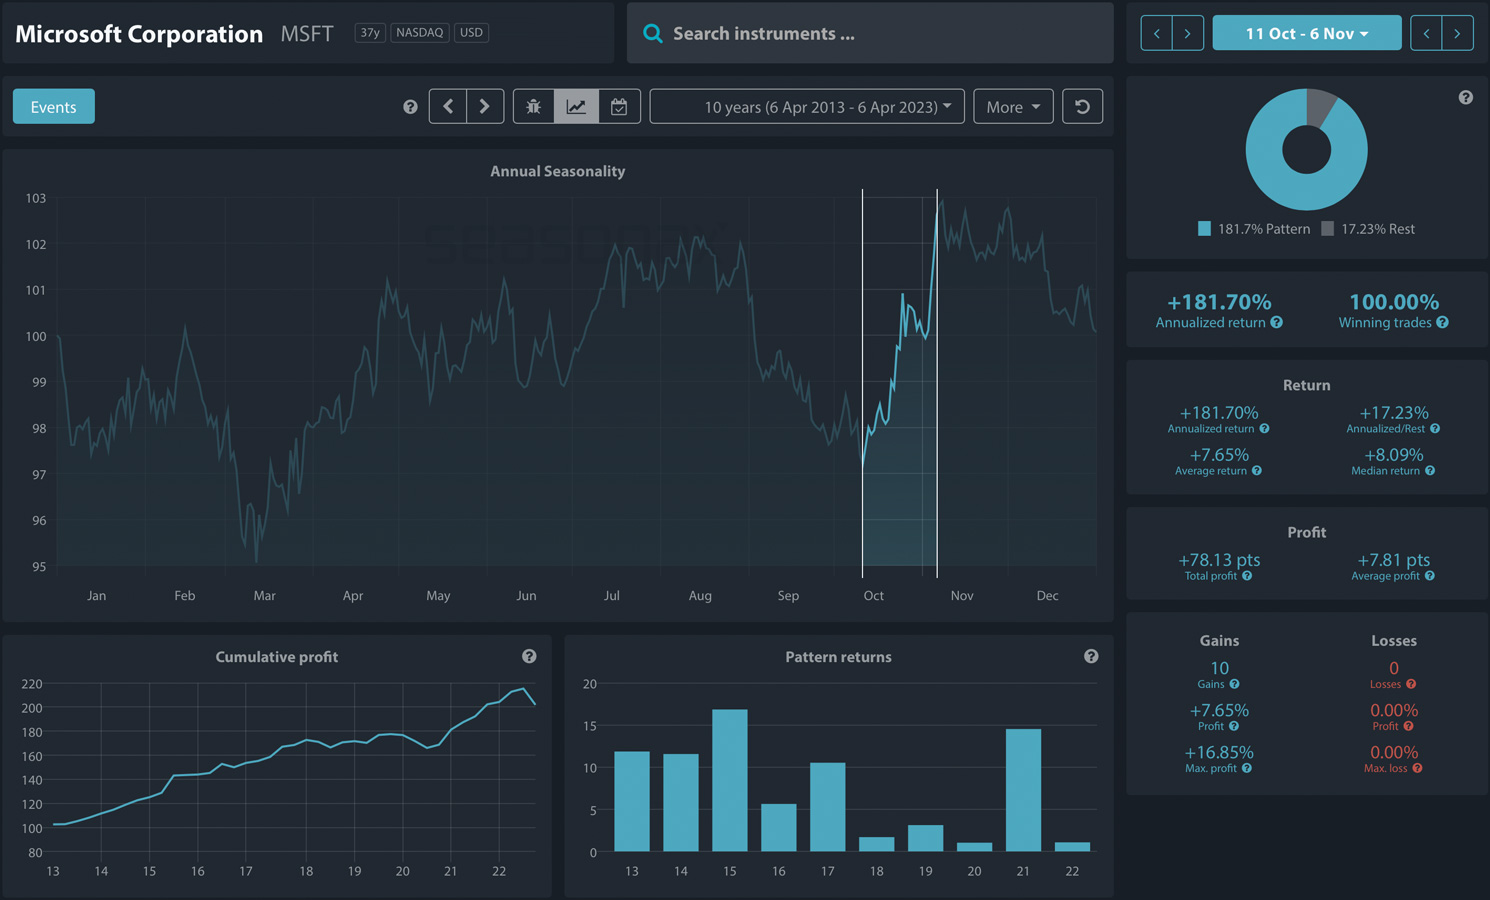
What is a seasonal chart?
Seasonal analysis helps identify predicable market patterns that occur repeatedly. You can use this information in the financial markets to add a high-probability edge to your trading strategy.
One way to do this is with the integration below.
One way to do this is with the integration below.


Integration: Looking for S&P500 opportunities?
The shortlist is calculdated and updated on a daily basis. The list is automatically ranked by historical win rate. If you are interested in integrating the Seasonal Opportunities on your website, get in contact with our sales team.
To integrate the iframe, copy this text:
<div>
<iframe src=”https://demo.seasonax.com” width=”800″ height=”850″ style=”border: none”></iframe>
</div>
To test the iframe on your website, it has to be whitelisted from Seasonax.
To integrate the iframe, copy this text:
<div>
<iframe src=”https://demo.seasonax.com” width=”800″ height=”850″ style=”border: none”></iframe>
</div>
To test the iframe on your website, it has to be whitelisted from Seasonax.
Want to dig deeper?
What does the data say?
Evidence from a 200+ year meta-analysis
Researchers from Erasmus University in Rotterdam have examined several investment strategies in 68 individual markets over up to 217 years of market history and concluded: Seasonality is the Best Investment Strategy!
How You can Benefit from little known seasonal and cyclical patterns
Dive deeper into the world of seasonality and watch the latest CMT webinar featuring our Head Analyst and Co-Founder Dimitri Speck