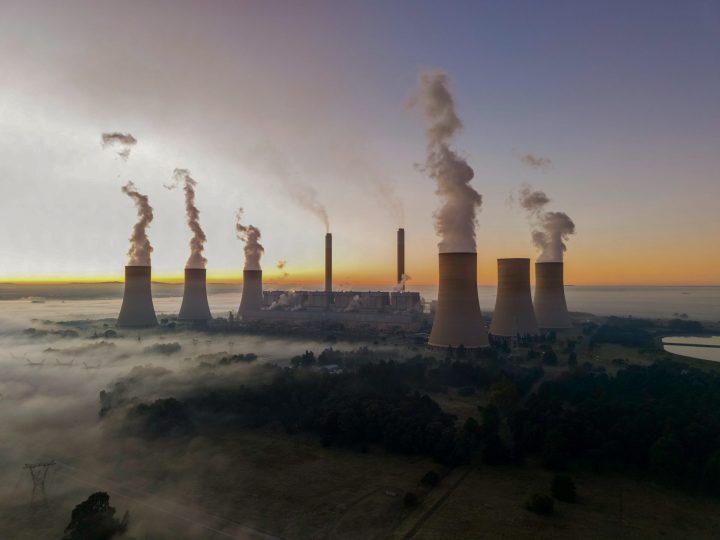
Entdecken Sie die saisonale Stärke im Konsumgütersektor, die traditionell von Ende Januar bis April besonders ausgeprägt ist. Mit möglichen wachstumsfreundlichen Maßnahmen unter Präsident Trump und positiven wirtschaftlichen Indikatoren wie stabiler Inflation und einem robusten Arbeitsmarkt könnte dies der ideale Zeitpunkt sein, um davon zu profitieren. Erfahren Sie mehr über Top-Performer die beeindruckende saisonale Renditen und Erfolgsquoten aufweisen.

Discover the seasonal strength in consumer discretionary stocks, a trend historically prominent from late January to April. With potential pro-growth policies under President Trump and favorable economic indicators like steady inflation and robust job growth, this could be an opportune moment to capitalize.

The Russell 2000 shows a striking seasonal pattern depending on whether the year ends with an odd or even digit. In even years, like 2024, small-cap stocks underperform significantly compared to the S&P 500, with a widening gap from March to October.

Discover the "Santa Claus Rally," a seasonal phenomenon with a history of boosting stock prices during the holiday season. Learn how it impacts markets like the S&P 500 and DAX, and what factors could influence this year's rally.

Gold has gained 50% in two years, but Newmont Mining has lagged behind. Seasonality shows its strongest phase is from November 27th to April 11th, with an average gain of 24.04%. Could now be the time to catch up?

When Trump first took office, he made waves in sectors like defense, traditional energy, and financials; he favored industries that aligned with his pro-business, domestic-focused agenda. Now, with Trump 2.0 in the White House, we’re diving into a potential golden age for "presidential stocks"—companies primed to rise with policy shifts that could drive the market.

Legend has it that the Halloween Effect originated in the City of London in the late 16th century and has been passed from trader to trader ever since. The stock market performance improves dramatically after October 31st, with the strongest returns seen between November and April.

Elections will take place in the USA on November 5th. In the media you can read a lot about the candidates Kamala Harris and Donald Trump. Certainly the political side is very important. But for you, as an investor, it is also important to consider how the markets behave during the elections.

You probably know the saying: “Sell in May and go away!” There is a lot of truth in this classic. Over the last 64 years, an investment in the Dow Jones achieved an average return of 6.60% in the winter half of the year, but only 0.09% in the summer half of the year from May - so practically nothing.

One of the primary implications of a Triple Witching Day is the surge in trading volume and market volatility. Traders and institutional investors scramble to offset, close, or roll over their positions.