
Trusted by 15,000+ Users
Meet Seasonax.
Uncover high-probability trades with the power of seasonal patterns
No payment details required!
Featured in
Get the seasonal edge
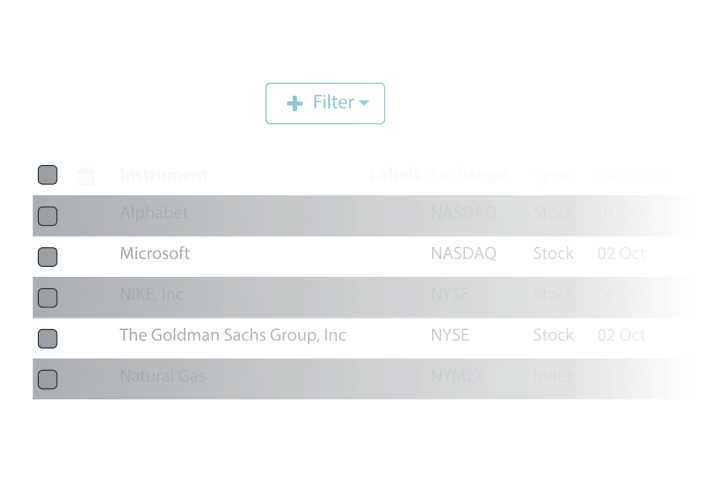
Find the best seasonal setups, fast.
Stop scanning blindly.
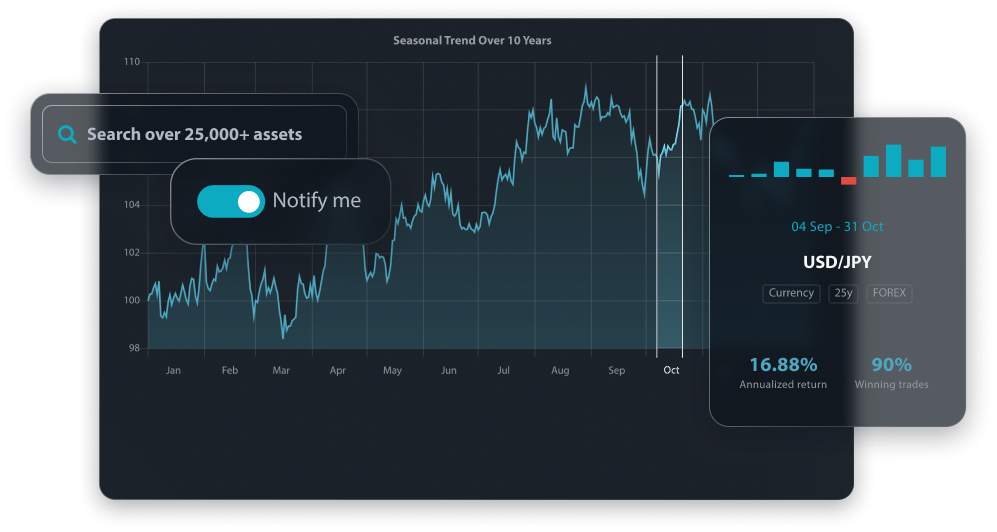
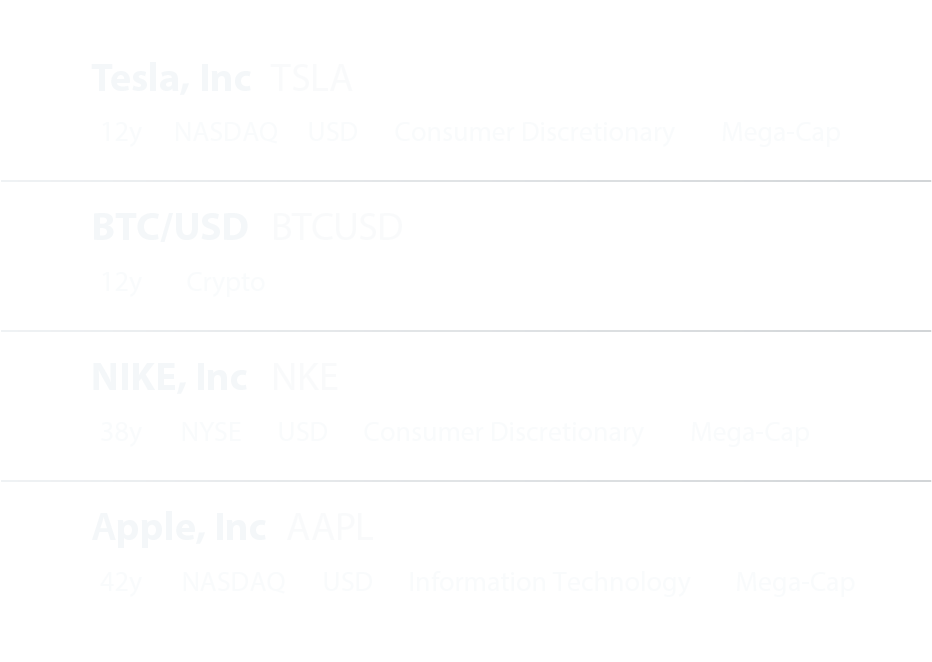
With the Seasonal Screener, you uncover your market’s best opportunities in seconds.
Every market has assets that tend to rise or fall at the same time each year. The Screener analyzes thousands of them and shows you only the ones with statistically backed seasonal patterns. Filter by market, timeframe and return threshold. You get a focused shortlist of opportunities, not a wall of noise.
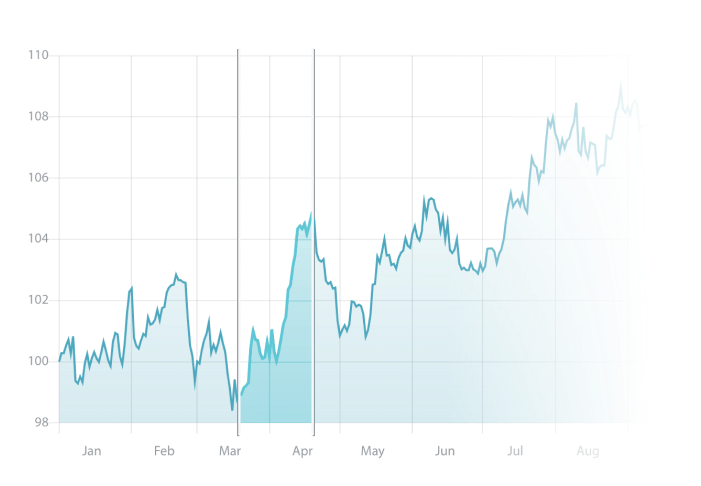
Know what you’re trading before you trade it.
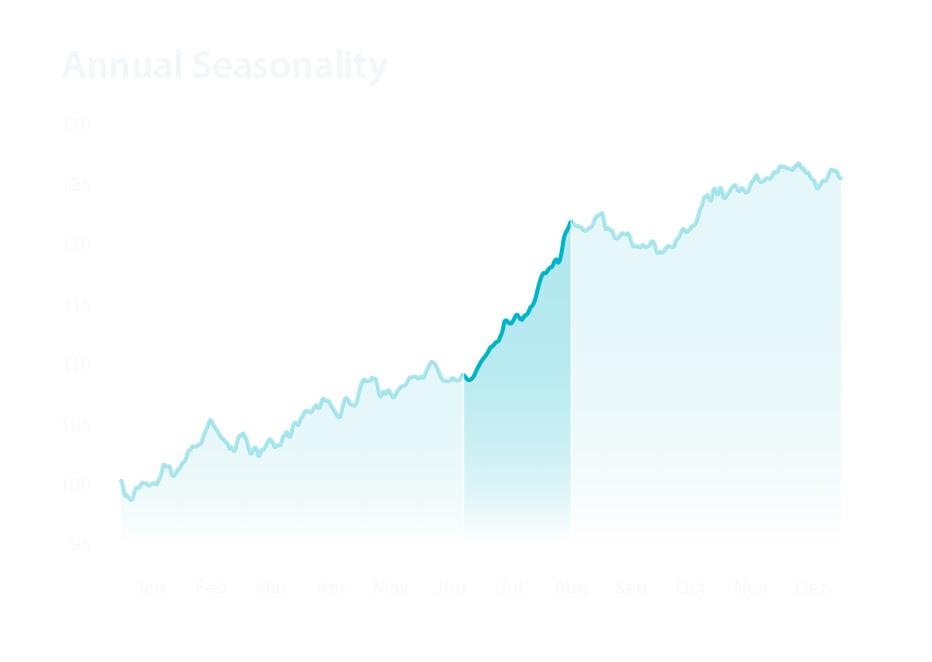
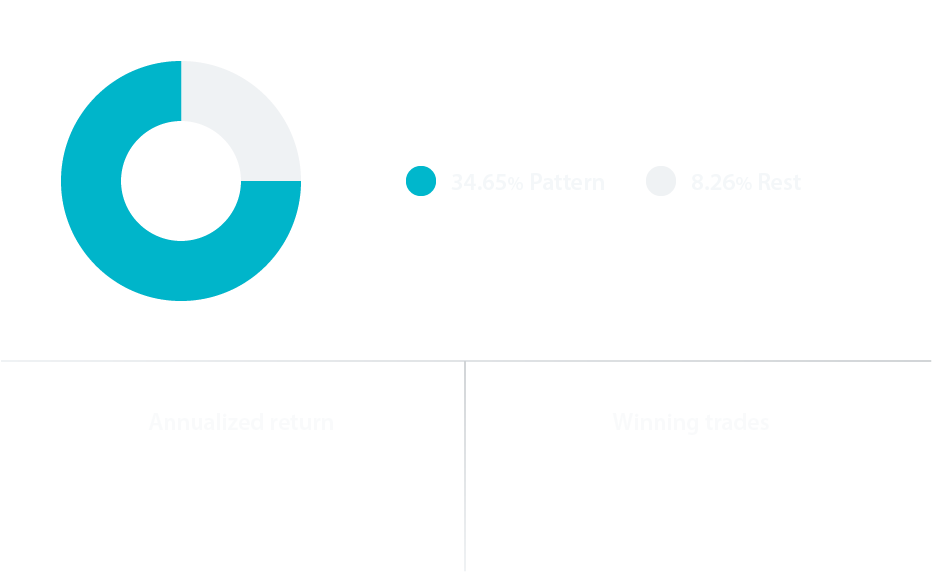
Thanks to the Seasonal Chart, you know exactly how any asset has moved, month by month, across decades.
See annual returns, total profit and key stats for any asset in one clean view. It’s easy to use, so you spend less time clicking and more time deciding. Use it to confirm a setup or dig into a new trade idea before you act.
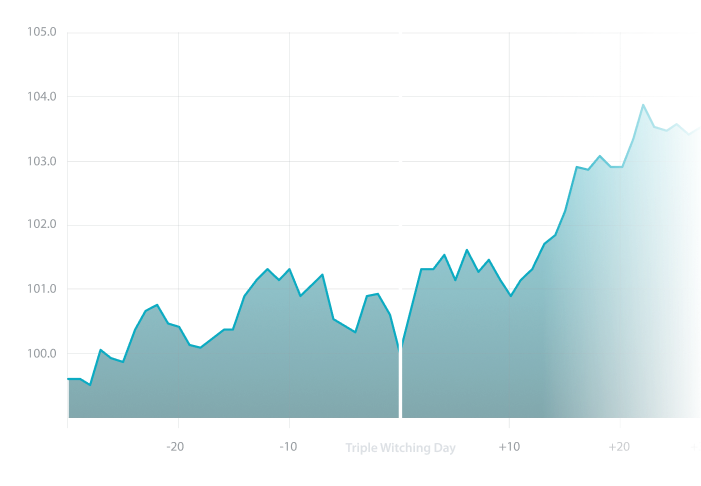
Trade market events with a clear edge.
Check how any asset tends to react around key market events, then plan your trade before the next one arrives.
Central bank decisions, economic reports, elections: these events move markets. Event Studies shows you the statistical trend for any asset around any key event. Trade with confidence thanks to a clear picture of what the data says could happen next.
World class traders love using Seasonax
Testimonials appearing on this website are not a guarantee of future performance or success.
Dive into our latest Seasonal Insights:

The Midterm-Year Rally in Gold
Read MoreThe Midterm-Year Rally in Gold
Summer Rotation: Why Healthcare Stocks Often Take the Lead in Q3
Read MoreSummer Rotation: Why Healthcare Stocks Often Take the Lead in Q3
The AI Boom Needs Energy. But Who’s Actually Supplying It?
Read MoreThe AI Boom Needs Energy. But Who’s Actually Supplying It?Identify bullish and bearish seasonal patterns
Unlock data once reserved for hedge funds and high-net-worth individuals. Start your free trial today.