SPECIAL SUMMER OFFER · ENDS JUNE 15
Fight “Sell in May” with Seasonality.
Find profitable patterns.
The Dow Jones makes 0% in summer.
Most traders accept that and sit it out. Seasonax users don’t. They find the stocks, commodities, and currencies that quietly print their best returns of the year between May and October.
Try it yourself: Get 2 months of Seasonax for free.
Most traders accept that and sit it out. Seasonax users don’t. They find the stocks, commodities, and currencies that quietly print their best returns of the year between May and October.
Try it yourself: Get 2 months of Seasonax for free.
“Sell in May” is real.
The data is brutal.
The saying has been around for decades and it still holds. Over the long run, the Dow Jones shows roughly 0% return during the summer months versus ~6.2% the rest of the year.

Seasonal chart of the Dow Jones Industrial Average over 25 years. From June 1 to October 1, the average return sits at -0.02% each year.
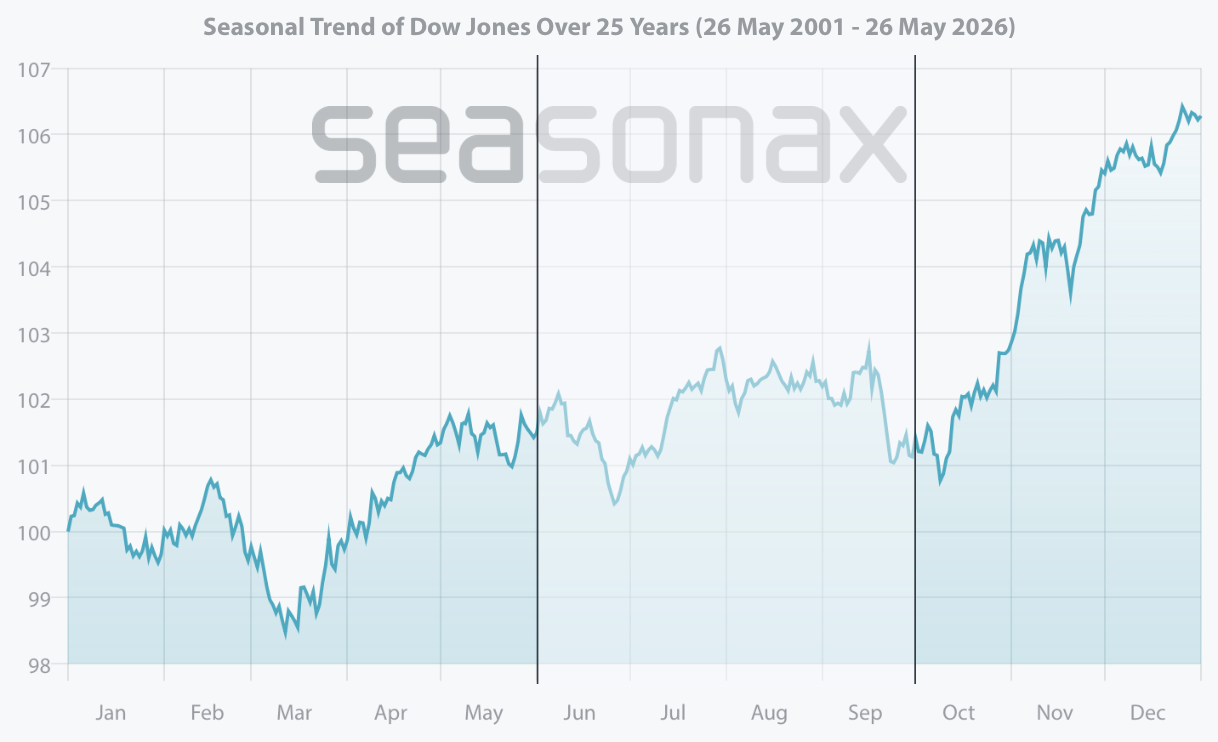
Seasonal chart of the Dow Jones Industrial Average over 25 years. From October 1 to June 1, it has generated an average return of +6.21% annually.
If you trade the index, summer costs you.
Six months of opportunity cost, every year, on repeat.
Six months of opportunity cost, every year, on repeat.
DJI
Average return
Annualized return
Win rate
Jun 1 – Oct 1
-0.02%
-0.07%
64.00%
Oct 1 – Jun 1
+6.21%
+9.47%
79.17%
Most traders accept this.
They go away. They wait.
They lose 6 months.
They go away. They wait.
They lose 6 months.
The edge they don’t see:
This is where most retail traders get it wrong. They look at the index, see weakness and assume the whole market is dead.
It isn’t.
Underneath the flat Dow Jones, specific assets enter their strongest seasonal windows of the entire year. Patterns that have repeated for 15, 20, sometimes 30 years.
It isn’t.
Underneath the flat Dow Jones, specific assets enter their strongest seasonal windows of the entire year. Patterns that have repeated for 15, 20, sometimes 30 years.
These are patterns visible in decades of data.
The traders who run them quarter after quarter aren’t smarter than you.
They just have the better tool.
The traders who run them quarter after quarter aren’t smarter than you.
They just have the better tool.
Find seasonal trades in seconds:
One tool. Three functions.
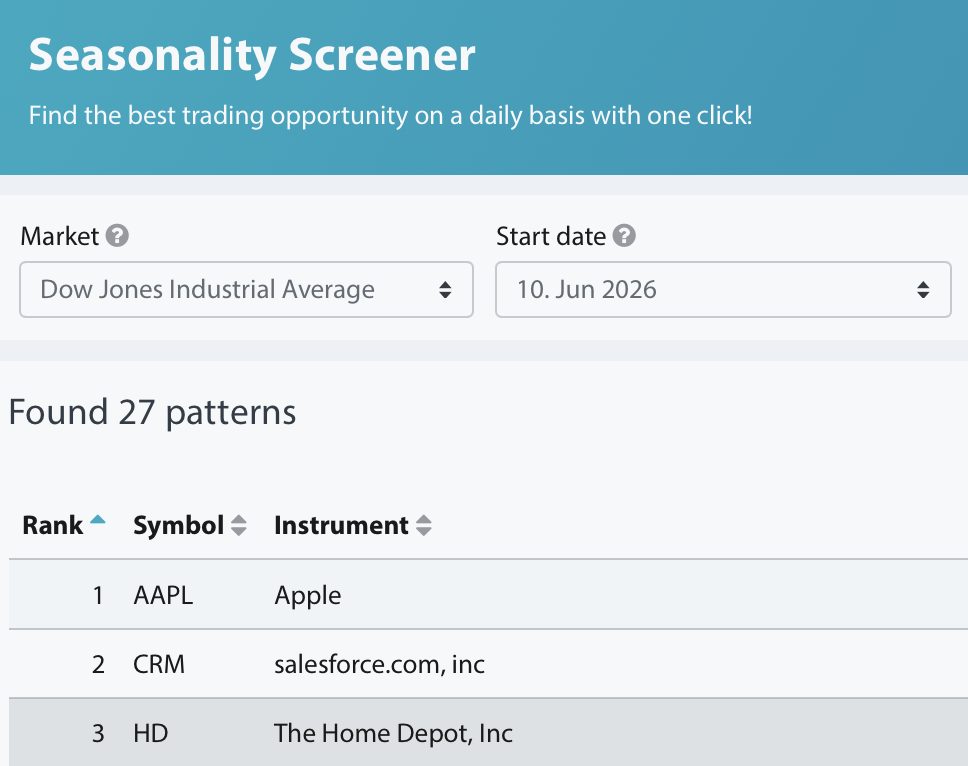
Seasonal screener
Filter thousands of instruments by statistically backed seasonal patterns. Set market, timeframe and historical returns to your liking. Get a focused shortlist.
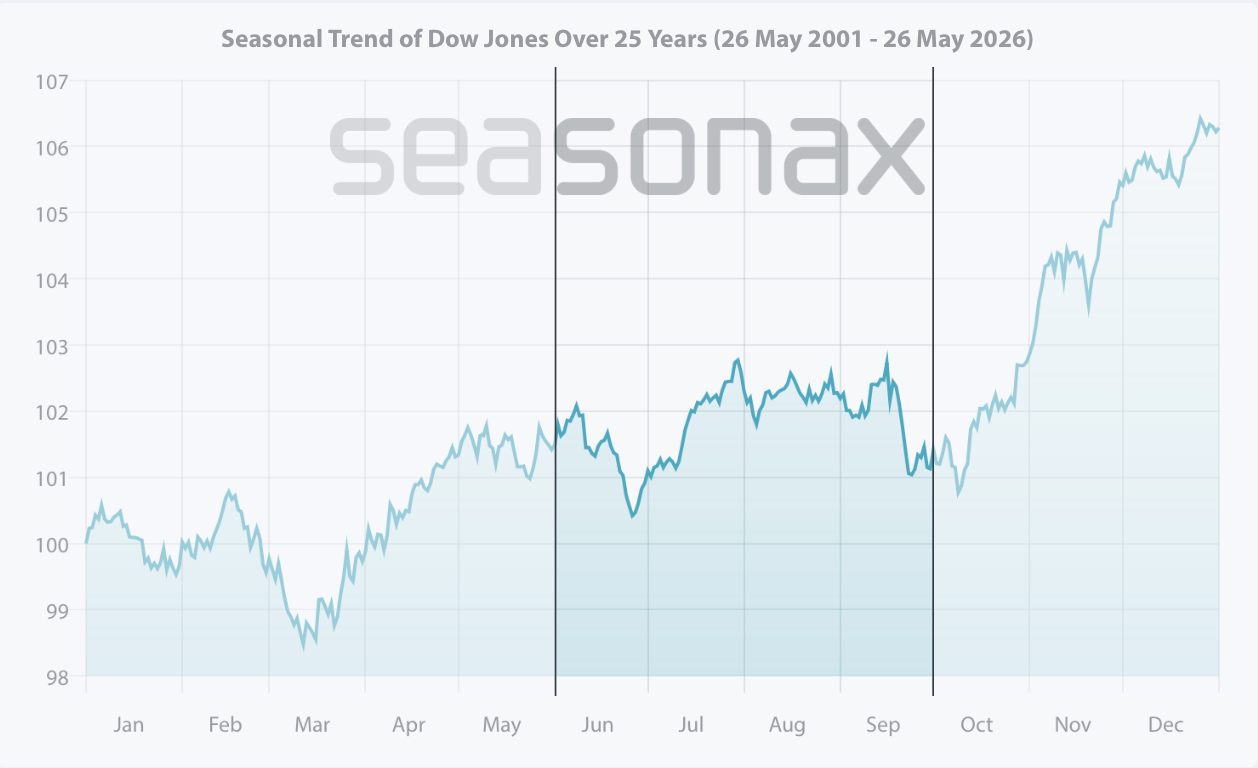
Seasonal chart
See historical returns, total profit and key stats for any asset across decades in one clean view. Confirm a setup or dig into a new idea in seconds.
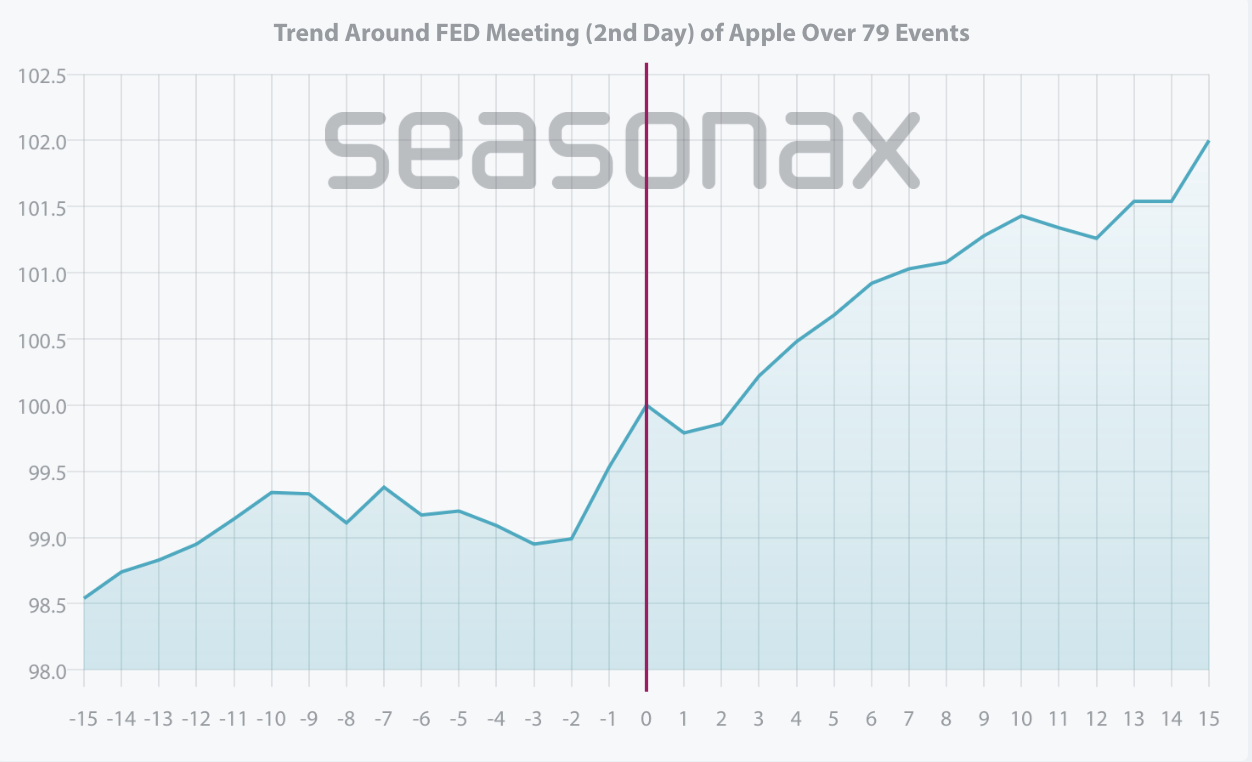
Event studies
Check how any asset reacts around central bank decisions, economic reports or elections. Plan your trade before the next event hits.
Trusted by thousands of traders, including portfolio managers at Insight Investment and quants at Bloomberg.
Right now, you win twice.
One decision. Two wins. One deadline.
1. You save on the subscription 12 months of Seasonax for the price of 10. Save up to $160 on your annual plan. Just 2 months free.
2. You gain summer setups others miss While the index drifts, you get the Seasonal Screener that surfaces assets quietly making their strongest moves of the year.
Pay for 10 months. Get 12.
Basic plan
• Analyze any instrument with up to 100 years of data
• Run intra-year and intra-month seasonal analysis
• Use the Seasonal Screener to find setups fast
• Access basic Event Studies and alerts
• Bookmark and track your most relevant patterns
• Run intra-year and intra-month seasonal analysis
• Use the Seasonal Screener to find setups fast
• Access basic Event Studies and alerts
• Bookmark and track your most relevant patterns
Get your first year for 415$!
Professional plan
• Compare instruments, sectors and single years side by side
• Access all 100 Event Studies with no restrictions
• Manage up to 3 portfolios and import custom data
• Use the full Seasonal Screener unlocking markets like the S&P500
• Multi-lingual customer support
• Access all 100 Event Studies with no restrictions
• Manage up to 3 portfolios and import custom data
• Use the full Seasonal Screener unlocking markets like the S&P500
• Multi-lingual customer support
Get your first year for 800$!
Offer expires on June 15, 2026.
–
DAYS
–
HOURS
–
MINUTES
–
SECONDS
Trusted by traders around the globe
Testimonials appearing on this website are not a guarantee of future performance or success.
Every day you wait is a setup you don’t see.
Between now and June 15, dozens of assets will enter their strongest seasonal windows of the year.
Some patterns last days. Some last weeks. None of them wait.
After June 15, this offer is gone and standard pricing returns: $500 for Basic, $960 for Professional.
Some patterns last days. Some last weeks. None of them wait.
After June 15, this offer is gone and standard pricing returns: $500 for Basic, $960 for Professional.
Quick Answers
How does the 12-for-10 offer work?
You pay the price of 10 months ($417 Basic / $800 Professional) and get full 12-month access. After 12 months, your subscription returns to regular pricing if you decide to stay.
How do I apply the offer?
If you click any link related to the offer, you are redirected to the Seasonax app. The coupon should be applied automatically. If this is not the case, navigate to the Subscription section and use the code SUMMER1.
When does the offer end?
June 15. After that, standard pricing applies: $500 Basic, $960 Professional.
I already have a free trial. Does the offer apply to me?
Yes. You can simply apply the coupon code or follow our link to redeem the offer.
Can I cancel at any time?
Yes. One click in your dashboard. You keep access through the end of your paid period.
What is the difference between Seasonax Basic and Seasonax Professional?
Basic offers you access to all Seasonal Charts, as well as limited access to the Seasonal Screener and Event Studies. With Professional, you analyze all Screener markets seemlessly, access any events as well as personalized baskets to analyze. For a full feature breakdown, visit our pricing page.
Will this be a recurring offer?
No. This is a one-time offer.