As 2023 closed out, the financial world buzzed with optimism. The S&P 500 surged over 24%, and the Dow neared historic highs, fueled by easing inflation, a resilient economy, and anticipated lower interest rates.
Notably, the market rally wasn’t just about big tech names like Nvidia, Amazon, and Microsoft propelling the Nasdaq’s 43% leap. It also marked a broader market uplift and a psychological shift for investors, embracing a promising close to the year and a diversified surge in stocks. With the Federal Reserve hinting at rate cuts in 2024, the financial horizon looks bright as we step into the election year.
Contrary to the expectations of many investors, statistically speaking it hardly matters for the stock markets whether a Republican or Democrat is elected. What matters is which year of the four-year election cycle we are in.
Performance of S&P500 during election years since 1932
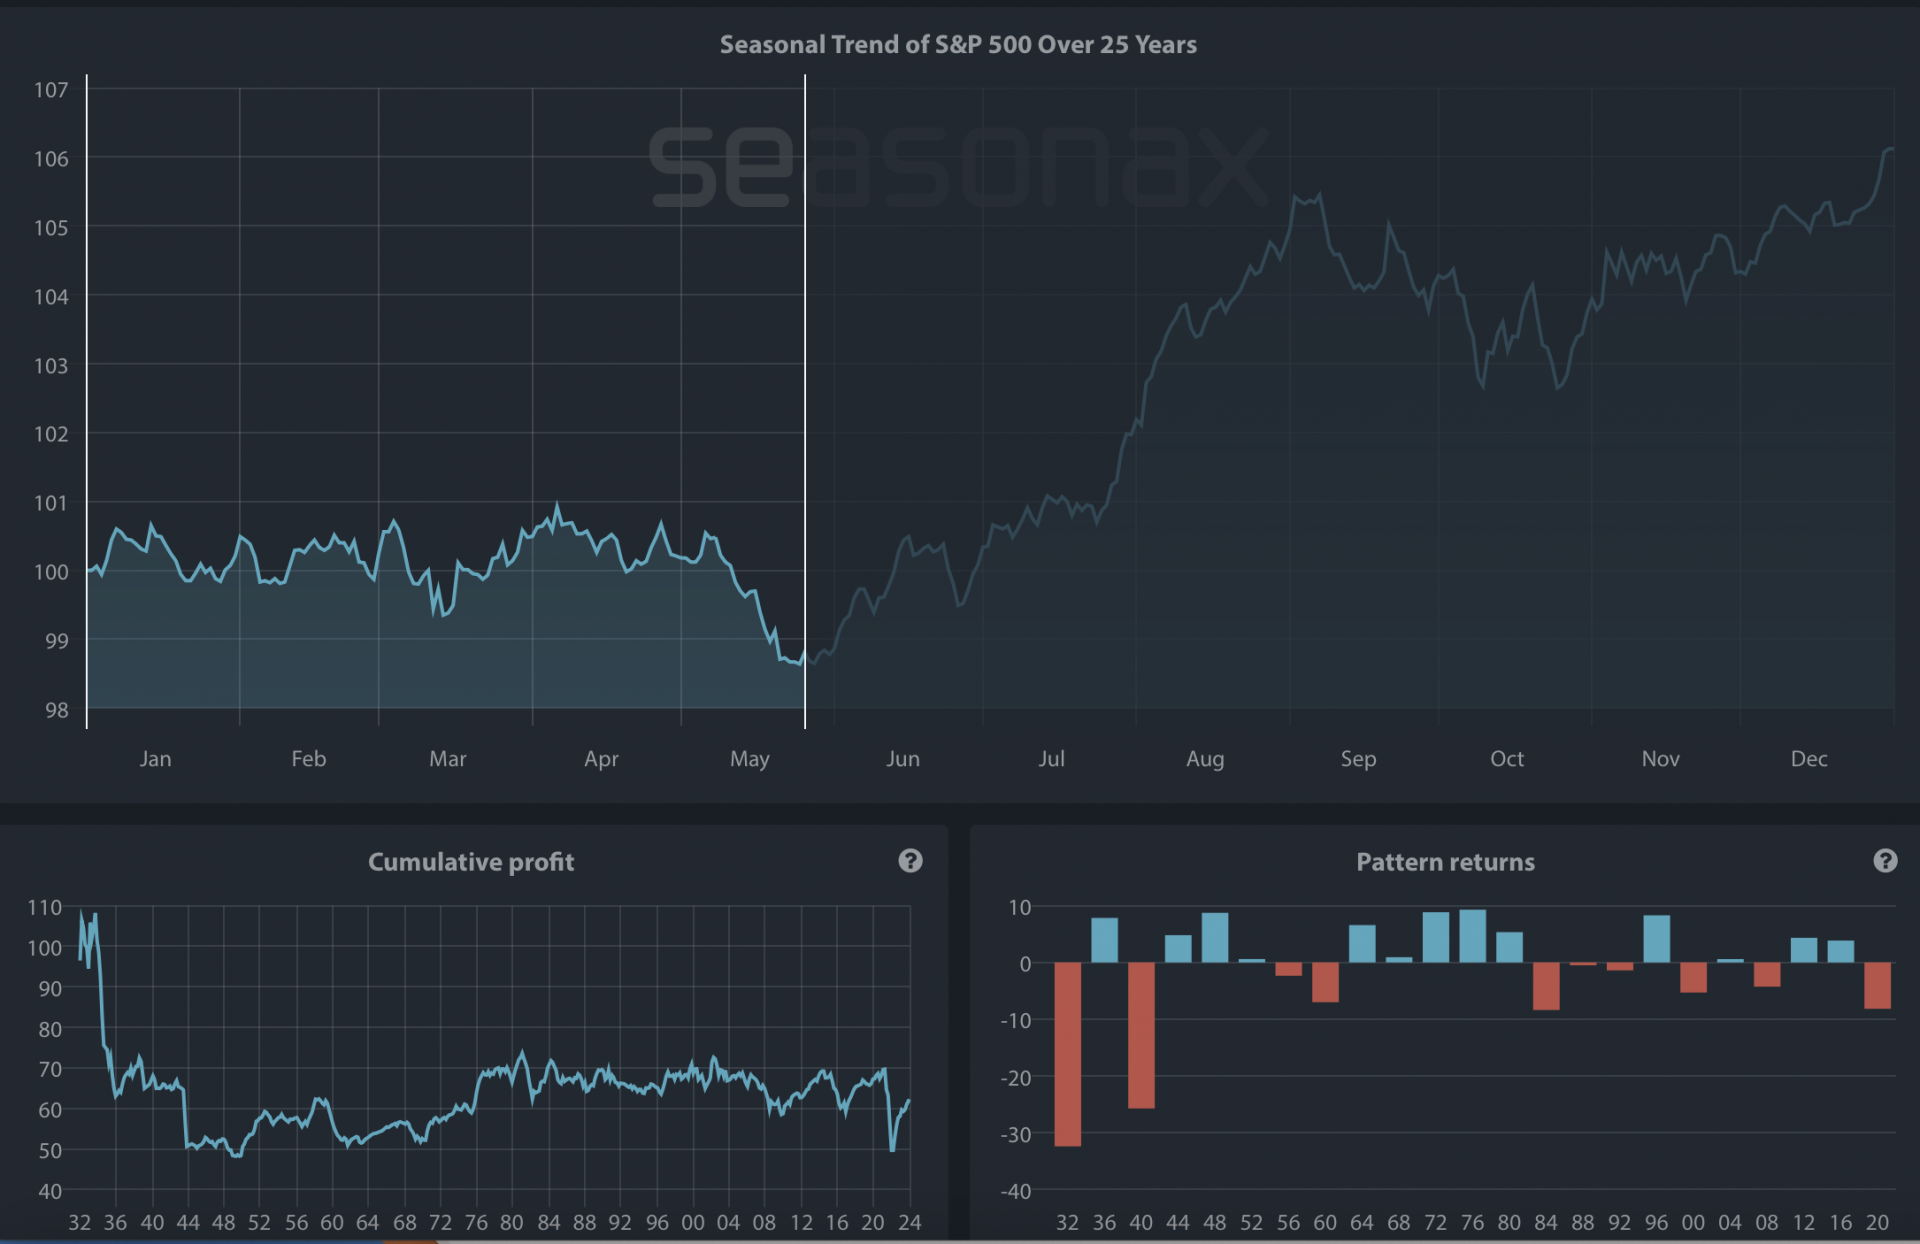
Source: Seasonax, sign up to access https://app.seasonax.com/signup all features and markets 30 days for free.
Although during election years S&P500 tends to have overall strong performance, there are still losses that occur mostly in the first half of the year. This is indicated in the pattern returns in the chart above, red bars indicate losses, and the blue bars gains during the first half of the election years since 1932.
Which sectors feel the election heat the most?
When the election season rolls in, it’s not just candidates that are on edge — certain market stocks and sectors are too!
A defense stock like Lockheed Martin often get more attention due to its big role in national defense, which both political parties’ support. Even though Republicans are usually seen as more pro-defense spending, nowadays both Democrats and Republicans agree on the need for a strong military. This could mean Lockheed Martin is a steady choice for investors during election time because it has long-term deals and a constant demand for its products.
Looking at the seasonal chart below, there has been a clear upward trend that starts in January and presents a good entry point for this stock. During this highlighted time period, over the last 10 years, Lockheed Martin made an average return of over 6.42% in only 33 trading days. This has reoccurred 10 out of 10 times since 2014.
Seasonal Chart of Lockheed Martin Corporation over the past 10 years
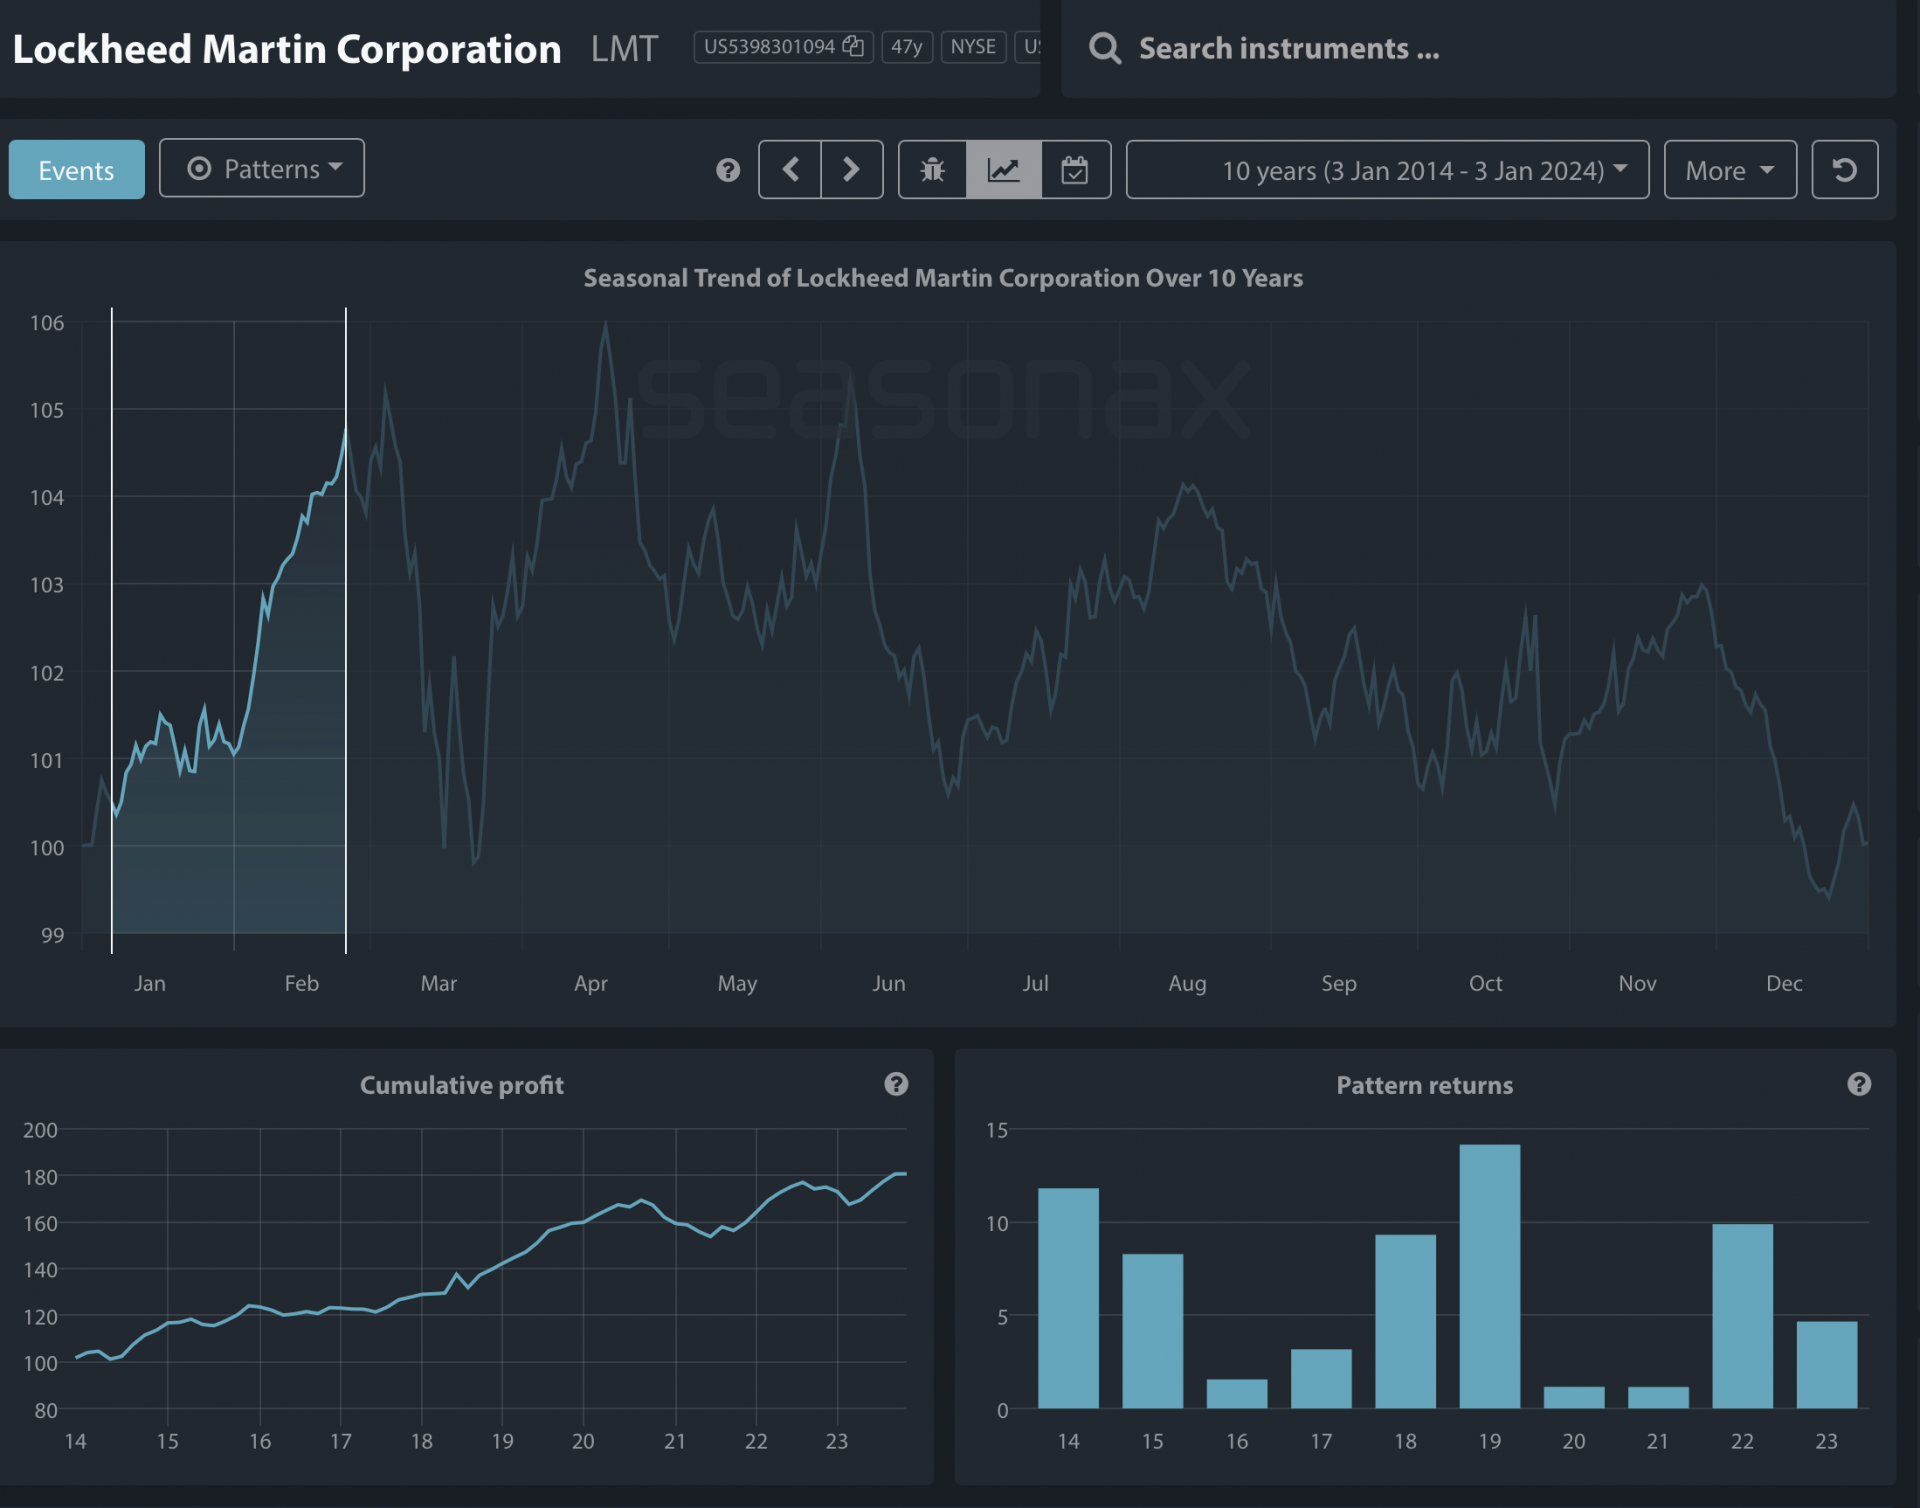
Source: Seasonax, sign up to access https://app.seasonax.com/signup all features and markets 30 days for free
Unlike regular charts, a seasonal chart doesn’t display price over a set time, but shows the average trend over several years. The horizontal axis represents the time of the year, and the vertical axis shows the % change in price (indexed to 100). The prices reflect end of day prices and do not include daily price fluctuations.
Meanwhile, healthcare stocks, which had a rough ride in 2023, could be a different prospect in the year ahead. Despite a tough year, with the S&P 500 Health Care index slightly down and the broader market up, things are changing.
Typically election years can be tough for healthcare stocks as politicians love to talk about cutting drug prices, unsettling investors, this coming election might be different. The leading candidates have been presidents before; we’ve seen what they’ve done (or not done). Trump didn’t change much about healthcare, and Biden’s big drug pricing policy is already in motion. So, this time around, investors might not be so quick to sell their healthcare shares.
Nevertheless, timing of when to enter and to exit these trades is key. The seasonal chart of Pfizer over the past decade reveals noticeable lows during the first three months of the year. While it is essential to note that past performance doesn’t guarantee future results, the regularity of these lows hints at a pattern that’s hard to ignore.
Seasonal Chart of Pfizer over the past 10 years
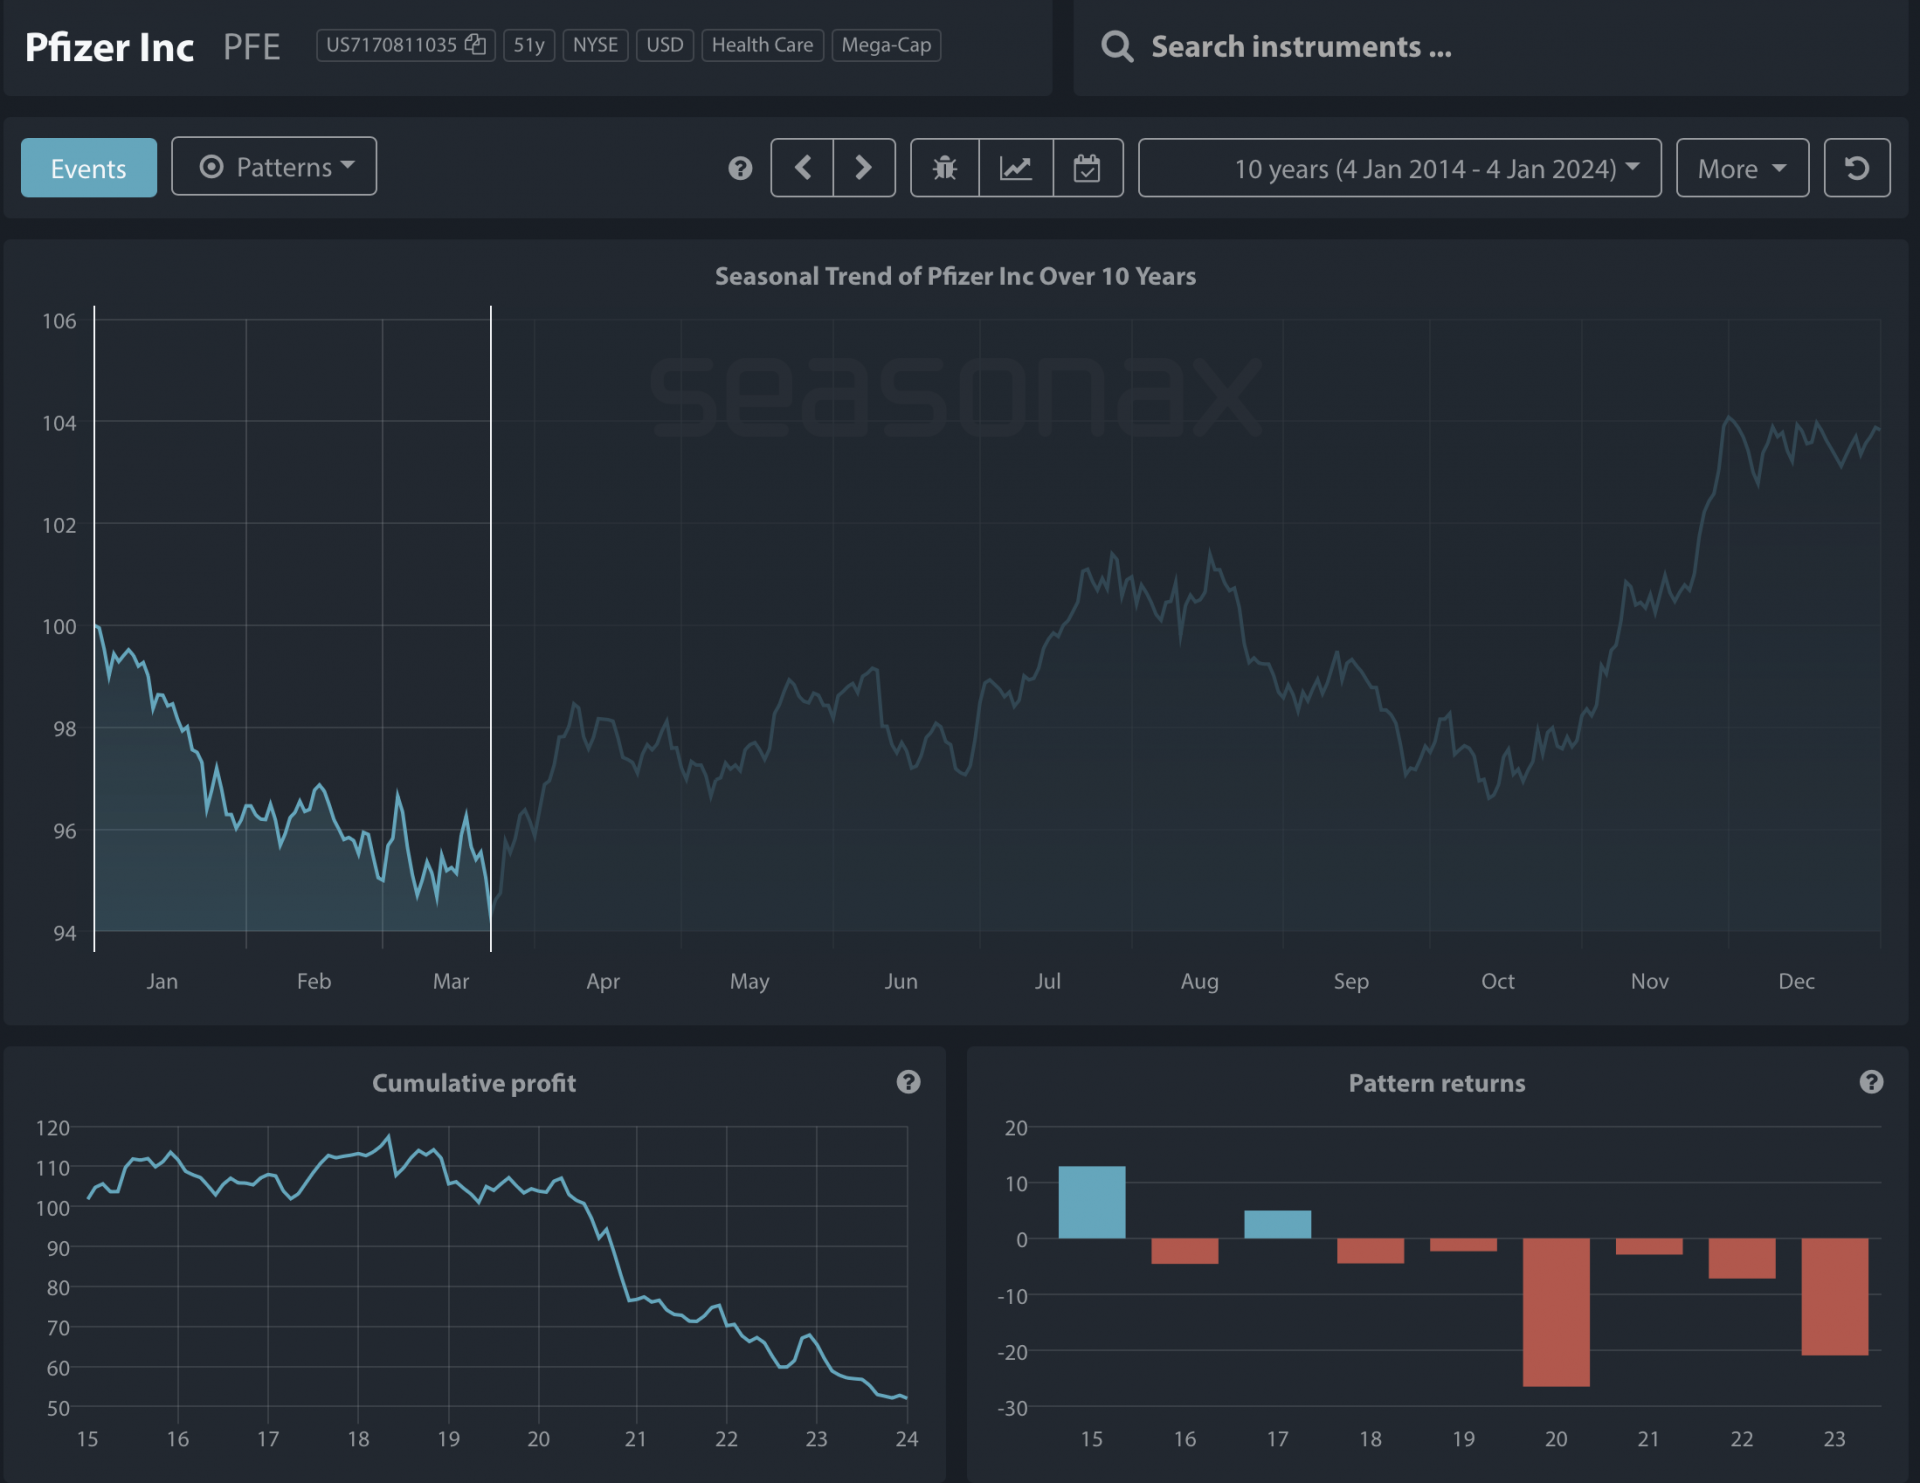
Source: Seasonax, sign up to access https://app.seasonax.com/signup all features and markets 30 days for free
In election cycles, certain sectors are particularly sensitive to shifts in political winds. Energy players like Exxon Mobil (XOM) and NextEra (NEE) are tuned to alterations in energy directives. Tech giants Apple (AAPL) and Microsoft (MSFT) keep an eye on evolving trade and tech regulations. Financial institutions such as JPMorgan (JPM) and Goldman Sachs (GS) are responsive to shifts in financial regulations and economic policies.
Investors need to be aware that while these industries are significantly influenced by electoral outcomes, stock performances are subject to a variety of factors and require careful analysis and a well-considered investment approach.
Before diving in, leverage Seasonax to pin down the best entry and exit points by studying recurring patterns and election cycles. With a free sign-up at www.seasonax.com, you get access to insights on a vast array of instruments, including various stocks, commodities, and indices.
Remember, don’t just trade it, Seasonax it!
Yours sincerely,
Tea Muratovic
Co-Founder and Managing Partner of Seasonax