Tutorials
Want to unlock the full potential of the Seasonax App? Our short, easy-to-follow video tutorials show you exactly how to make the most of key features – from powerful search tools to custom pattern analysis.
Whether you’re just getting started or looking to dive deeper, these clips will help you turn insights into smarter trading decisions – step by step, in just minutes.
Seasonax Tutorial: Featured patterns for monthly inspiration
Read MoreSeasonax Tutorial: Featured patterns for monthly inspiration
Seasonax Tutorial: Exclude outlier years from Seasonax
Read MoreSeasonax Tutorial: Exclude outlier years from Seasonax
Seasonax Tutorial: DXY Strength Revealed
Read MoreSeasonax Tutorial: DXY Strength Revealed
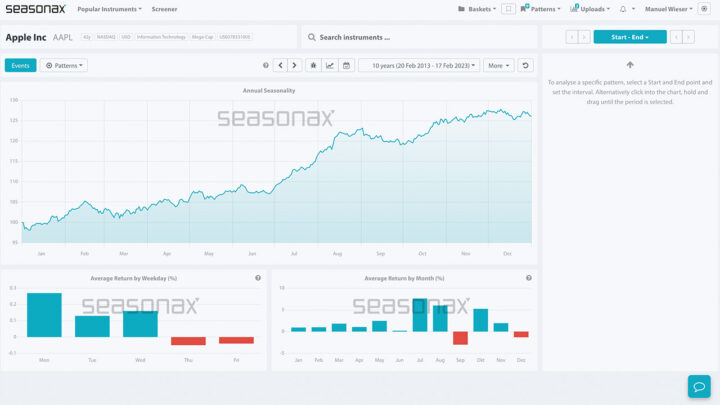
Seasonax Tutorial: Detailed Statistics
Make use of detailed Statistics and give Your Trading a Statistical Edge.
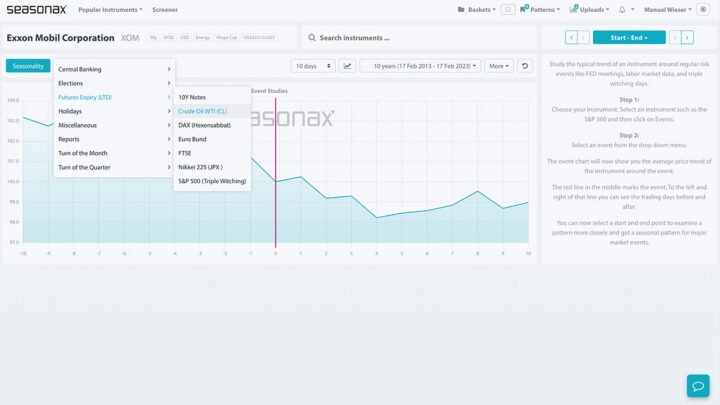
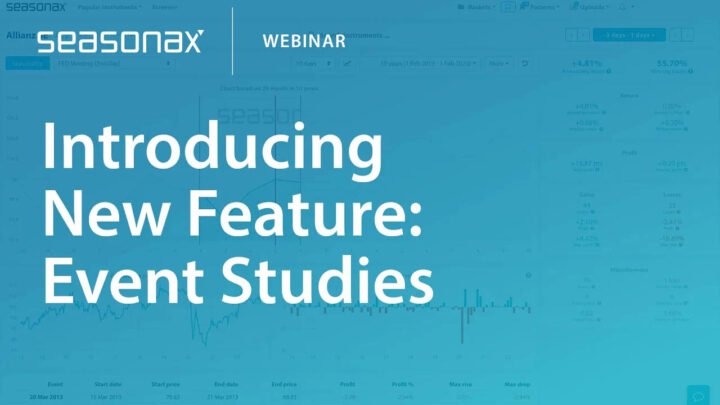
Seasonax Tutorial: Special Events Charts
Make use of Special Events Charts to quickly Identify Price Trends Around Major Events
Seasonax Feature: Watchlists and Alerts
Set your Watchlists and Alerts and Never Miss a Profitable Trade Again
Webinar: Benefit From Seasonality and Events With Seasonax
We are pleased to present our webinar “Profit from Seasonality and Events with Seasonax” with Seasonax founder and book author Dimitri Speck. In our webinar you will learn why seasonal patterns recur so often and how you can benefit from…

Seasonax Feature Tutorial: Get email notifications
In this Tutorial we will show you how to manage your patterns and most importantly: How to receive email notifications for your bookmarked patterns.
Seasonax Feature Tutorial: Screen your baskets
In this tutorial we will show you how to search your individual baskets for interesting trading patterns using the Seasonality Screener and add a pattern to your patterns.
Seasonax Feature Tutorial: Basket management
The Basket Management feature gives you the ideal area to store instruments you are actively tracking. Furthermore, with your Business Account, this feature also allows you to search your individual baskets for interesting patterns.