Author: Salah-Eddine Bouhmidi
There are many myths surrounding the topic of seasonality among traders and scientists alike. Seasonal patterns in the stock market are a topic of their own. Are regularly recurring patterns a purely random phenomenon, or can they be explained by certain market behavior? The fact is that there are regular recurring patterns in the markets that can provide a significant advantage when taken into consideration in decision-making.
Various markets and sectors show seasonal trends. Some of these seasonal patterns can be attributed obviously to fundamental causes, while others arise more randomly. The most well-known seasonal influences are harvest periods, interest repayments, weather conditions, investor sentiment at certain times of year, tax reporting deadlines, annual or quarterly financial reports, as well as classic patterns in the investment markets such as the traditional year-end price increase, also known as the year-end rally. To find suitable individual stocks and be able to invest throughout the year, it is necessary to examine comprehensive historical data for each individual stock in order to identify and evaluate seasonal patterns accurately and thus be able to make a selection.
We are all familiar with seasonal fruits and vegetables as well as the associated price fluctuations throughout the year. When we classify seasonality historically and economically, we must start with the asset class of commodities, primarily agricultural commodities. Recurring seasonal patterns can always be identified in agricultural products, as they are highly dependent on weather and seasons as well as external influences.
Even in the stock markets, historically regular and predictable patterns can be identified. A very classic and well-known seasonal pattern in the stock markets is the so-called year-end rally. The end of each calendar year seems to historically exhibit clear strong upward trends, which can have various reasons.
In Figure 1, we look at the S&P 500. This index includes stocks from 500 of the largest publicly traded US companies. It is clearly visible that the stock index from January 1, 1928 to January 1, 2024, on average, has a significantly positive tendency towards the end of the year. Stocks in the S&P 500 tend to rise from October to December. In the last 96 years, the S&P 500 rose in 68 out of 96 cases between October and December. This clearly indicates the seasonal tendency at the end of the year. This phenomenon can also be observed in other stock markets such as the German benchmark index DAX 40.
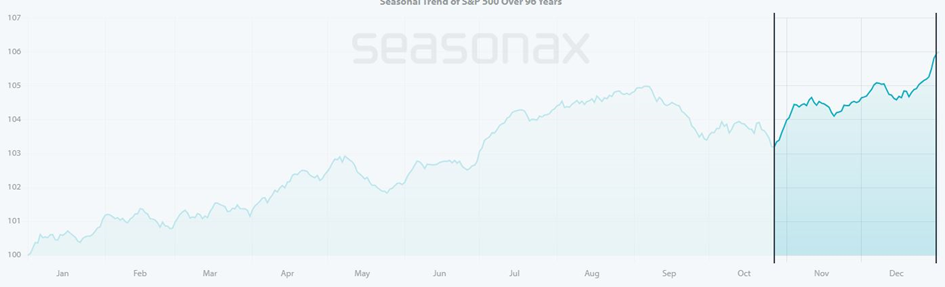
Source: Seasonax.com
The selection of the time frame is crucial for observing seasonal patterns. The number of years to be used as a basis depends on various factors. Typically, 15 to 25 years are sufficient to identify and analyze seasonal trends. This timeframe provides enough data to recognize consistent patterns and takes into account short-term influencing factors. It is important that the chosen time frame is representative of the market and the investment. Too short periods can lead to distorted results, while too long periods may no longer be relevant, as market conditions may change. In Figure 2, we once again looked at the seasonal analysis of the S&P 500 over the last 25 years and found the same result as with the 96 years: The year-end rally extends over a century, confirming the strength of the seasonal pattern.
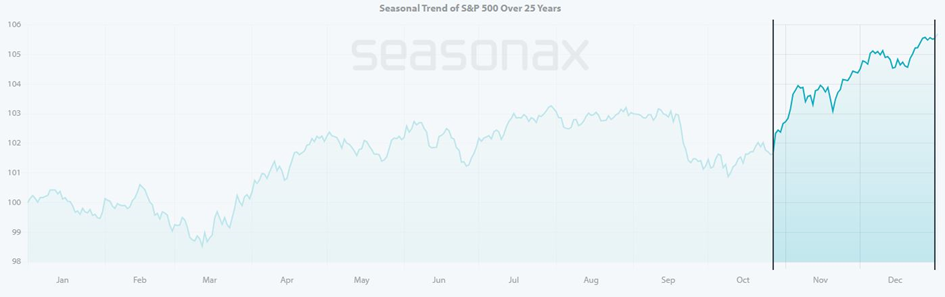
Source: Seasonax.com
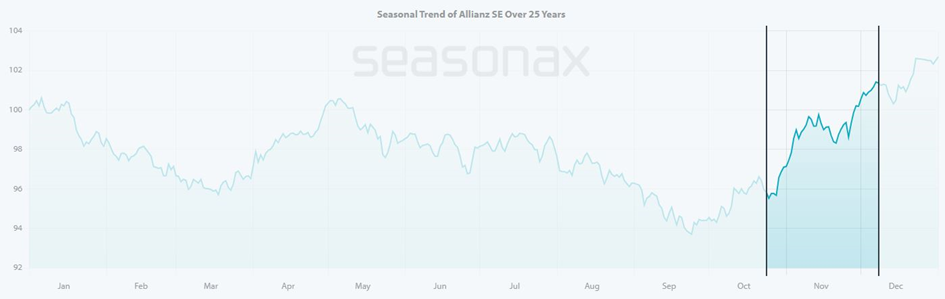
The question of whether the observed noticeable trend is also statistically significant and whether we should take this seasonal pattern into account in our decision-making process will be examined now. First, we look at the typical seasonal pattern of a stock using a seasonal chart. As described , we usually focus on a seasonal chart with a data basis of 15 to 25 years. First, we look with the just the eye for noticeable positive or negative trends in the seasonal chart. In our example in Figure 3, we have chosen the stock of one of the world’s largest insurers, namely Allianz SE. It is noticeable that in the seasonal chart of Allianz SE shown, the stock has a clear positive tendency at the end of the year in the last 25 years, more precisely in the period from October 25 to December 7.
After identifying the obvious recurring up and down trends, we will examine them in more detail. This means looking at the statistical figures to check whether there is indeed a strong and meaningful seasonal pattern. For this, investors should rely on important statistics from descriptive statistics to interpret and effectively use the seasonal pattern. It is important to analyze the seasonal pattern based on relevant statistical figures to understand the strength, opportunities and risks of the pattern and make decisions based on them. In the following, we will analyze the strength of the pattern using a selected stock as an example and explain which figures to pay particular attention to. The following set up statistics that can be checked on seasonax.com are:
- Winning Trades / Hit rate
- Average Return
- Standard Deviation
- Average Profit / Loss
- Maximal Profit / Loss
- Past 5 years
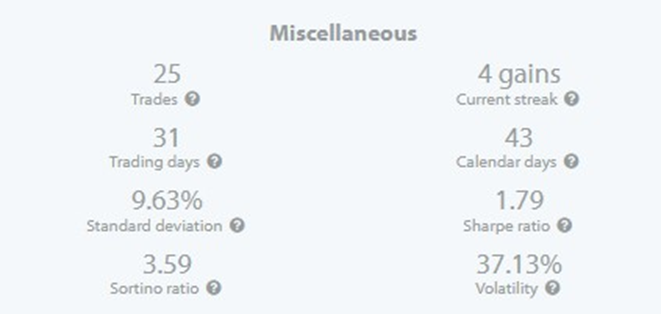
After visually recognizing the clear upward trend at the end of the year in Figure 3, we now turn our attention to the statistical analysis to examine the seasonal pattern more closely. Figure 4 summarizes all the statistical indicators mentioned above that are important for evaluating a seasonal pattern. As an example, we conduct the analysis using the stock of Allianz SE.
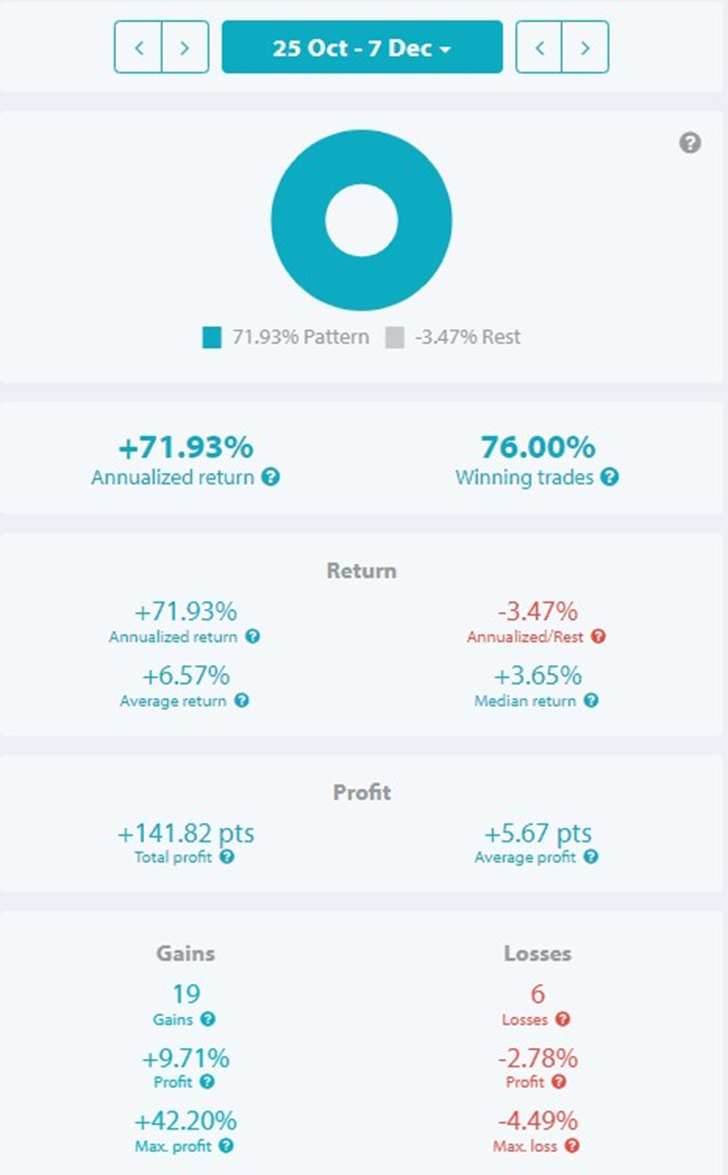
Source: Seasonax.com
In the following, I will explain step by step all the statistical variables and show how they can be interpreted. This will provide us with insight into whether it is a strong or rather doubtful seasonal pattern.
The hit rate describes the percentage ratio between positive and negative price developments in the seasonal period. It should be at least 60%. However, it is important to note that a high hit rate alone does not necessarily lead to success. Among the statistical figures, the hit rate has the lowest significance. In our example, the hit rate for Allianz stock over the past 25 years from October 25 to December 7 was 76%. In 19 out of 25 years, the stock rose during this period.
Much more important than the hit rate are the average return and standard deviation in the observed period. The average price development is determined by calculating the cumulative price development for the entire observation period in a selected time period per year and relating it to the observation period. If there is a positive average return, this indicates an upward trend in the period. If there is a negative average return, a downward trend is to be expected. This can also be the case even if the hit rate was positive. When interpreting the average return, “outliers” should also be considered. Excessively positive or negative years such as the Corona crisis, financial crisis, or wars can distort the average return and distort the picture. However, the average return should not be viewed in isolation.
The standard deviation, abbreviated by the Greek letter σ, is the statistical measure of the intensity of fluctuations in a data series around its average or mean. Put simply, the standard deviation represents the average deviation of all observable values in a data series from the average. A high standard deviation indicates a large intensity of fluctuations, while a low standard deviation indicates a small deviation from the measured mean. In the following example, we see that the average return for Allianz SE in the observed seasonal period is 6.57%, with a standard deviation σ of 9.63%. This means specifically that the stock of Allianz SE fluctuates on average by 9.63% in the period from October 25th to December 7th over the last 25 years. This corresponds to a range of -3.06% to +16.20%. The standard deviation of the seasonal pattern is also important later for risk and money management (position size, stop loss or exit), as well as for assessing personal risk tolerance. Risk-averse investors tend to prefer less fluctuation-intensive seasonal patterns, while risk-seeking investors are more willing to include more fluctuation-intensive seasonal patterns in their portfolio. It is clear that a higher standard deviation often goes hand in hand with a higher average return, and vice versa. The standard deviation also helps in choosing between two stocks that exhibit a strikingly strong seasonal pattern in the same period and have the same success rate and average return. In this case, it is more sensible to select the stock with a lower standard deviation, as you would have to endure less fluctuations for the same return.
The comparison of average profit and loss is an important metric that we should consider. The average profits should always be greater than the average losses to confirm the strength of the buying pattern. However, if the average losses outweigh, this indicates a downward trend in the period and could even lead to questionable seasonality that is visible to the naked eye. In our example, the Allianz stock shows a significantly higher average profit than loss. Over the past 25 years, the stock achieved an average profit of 9.71% in the period from October 25 to December 7. In years when the pattern did not hold true, there was an average loss of -2.78%.
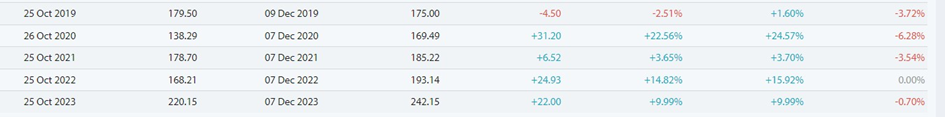
Another important measure for seasonal analysis involves comparing the maximum gains and losses of the seasonal period under investigation. The maximum gains should always be greater than the maximum losses. In Figure 4, the maximum gains and losses of Allianz stock over the past 25 years for the period from October 25th to December 7th are shown. The highest gain the stock had in this seasonal period was 42.20% in 2008, while the highest loss was -4.49% in 2007. The average gains are almost ten times higher than the average losses, indicating a clear positive trend in the stock during this seasonal period.
Finally, it is important to note that seasonality can undergo a change. Therefore, it is advantageous to include as many years as possible in the calculation, as mentioned, at least considering 15 or 25 years. It is also advisable to review the short-term retrospect to see if the seasonal pattern may have significantly changed in the last five or ten years. For this, we also always consider the development of the seasonal pattern of the past five years. The last five years should also show a certain consistency and mostly correspond to the seasonal pattern under consideration. In our example, we see this with Allianz SE, where the seasonal pattern has occurred for four years in a row.
Source: Seasonax.com
We have found that it is not sufficient to only detect a seasonal pattern with just the eye. By including important statistical figures that we can do with seasonax, a much better picture of the seasonal pattern is obtained, strengthening or weakening the decision in the selection process accordingly. The example of Allianz SE presented shows a clear seasonal starting phase in the period under review and could be an interesting investment opportunity based solely on seasonal factors. Next to Price, Volume and Volatility is seasonality a basic of my trading approach.
Authors Bio: Salah-Eddine Bouhmidi is an innovative financial analyst and market strategist known for his development of the Bouhmidi Bands. With an academic background in quantitative finance and economics, Salah-Eddine has significantly impacted technical analysis in financial markets through this creation. Salah-Eddine is valued for his incisive market commentaries and has been a featured expert in numerous financial interviews, webinars and publications.