Dear Investor,
In this issue of our Seasonal Insights, we will use the opportunity to inform you about how you can use our tools to analyse seasonal patterns without having access to a Bloomberg or Thomson Reuters terminal.
Analyse seasonality from wherever you are
As you know, I have come up with a set of algorithms to facilitate pattern recognition for subscribers of our application, which is featured on Bloomberg Professional and Thomson Reuters Eikon. Upon numerous requests by subscribers of this newsletter, we have worked on creating a web-based application – for those of you who want to profit from seasonality but do not have access to above-mentioned services.
Aetna Inc as an example for a seasonal investment opportunity
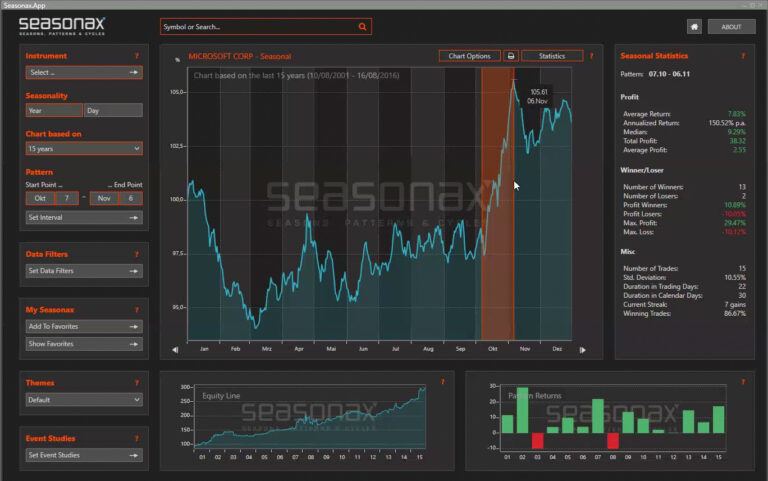
Let’s look at an example. On our website app.seasonax.com we recommend monthly trading picks, which have shown distinct seasonal patterns over the last years. In May, we have chosen Aetna Inc. as a trading opportunity. Aetna Inc. is a service company, selling health care plans to consumers, especially employees. Its products include medical, pharmaceutical, dental, behavioral health, long-term care, and disability plans. Our analysis had shown that the month of May shows a clear seasonal investment opportunity for this stock. In our application, you can choose any time period you want to examine, we have chosen May 4 to June 4.

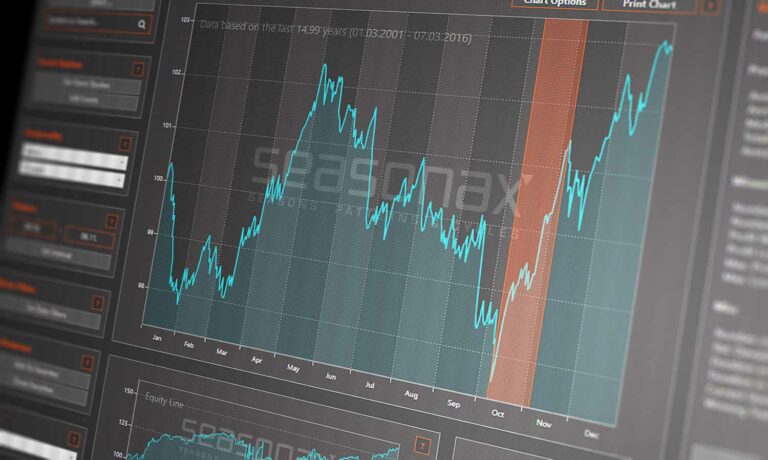
Seasonal chart depicting the analysis – highlighting the period May to June. Note that seasonal charts are normally year-round.
Source: app.seasonax.com
Dive deeper and get detailed seasonal statistics
Our application gives you more opportunities than to merely visually depict seasonal trends. You have the option to share or save the charts, to use them for presentations or other purposes. Furthermore, you can look at the cumulative profits as well as the pattern returns – both are illustrated in appealing charts.

Screenshot from the application, showing cumulative profits of the stock since 2004.
Source: app.seasonax.com

Screenshot from the application, showing pattern returns of the stock since 2004.
Source: app.seasonax.com
As you can easily observe from the visualized data, the stock has shown extraordinary statistical stability, delivering stable returns in the month of May, thereby representing an excellent investment opportunity.
To further analyse the stock and back your trading decision, you can access the detailed statistics. These statistics include the annualized and average return in %, the percentage of winning trades in the time period you have chosen, the average profit, standard deviation and much more information.

Screenshot of the visualized key stats for the stock.
Source: app.seasonax.com

Screenshot of the detailed statistics section within our application.
Source: app.seasonax.com
Because of the above-mentioned statistical evidence, we have chosen to recommend Aetna Inc. as a trading opportunity for May. As you can see, this year was no exception and trading our recommended stock would have resulted in profits for the respective time period. You can access more detailed information about seasonality on our website app.seasonax.com, where you can also find an explanatory video tutorial on how to use the application.
Naturally, there are no guarantees in the market but you can do your best to let probabilities work in your favour!