Dear Investor,
In the context of seasonality, you may – just like most investors – primarily think of commodities and stock indexes.
However, there are seasonal patterns in many other markets and instruments as well, ranging from individual stocks to currencies.
For instance, are you aware of the fact that an exciting seasonal pattern is currently unfolding with the US dollar? Even if you are not focusing on FOREX markets in your investing activity, the seasonal trends of the US dollar are probably important for you as an investor in stocks or bonds.
Let us therefore take a look at the seasonal pattern of the US Dollar Index.
The US Dollar Index directly shows the trend in the US dollar’s external value
The US Dollar Index is an index that represents the value of the US dollar, in the form of a basket containing six currencies:
- EUR (euro): 57.6% weighting
- JPY (Japanese yen): 13.6% weighting
- GBP (British pound sterling): 11.9% weighting
- CAD (Canadian dollar): 9.1% weighting
- SEK (Swedish crown): 4.2% weighting
- CHF (Swiss franc): 3.6% weighting
Source: Wikipedia
Thus the USD Index (DXY) directly shows the trend in the external value of the US dollar. It rises when the US dollar appreciates, and conversely declines when the US dollar weakens.
The US dollar exhibits seasonal weakness at the end of the year
The US dollar index is therefore also well suited for seasonal analysis of the US dollar. How does the US dollar look seasonally until the end of the year?
The bar chart below shows you the return of the US Dollar Index for the past 50 years, for the period between December 1 and January 1 of the following year. In red you can see the years in which there were losses, in blue those in which there were gains.
Return in percent of the US Dollar Index between December 1 and January 1, for every year since 1971
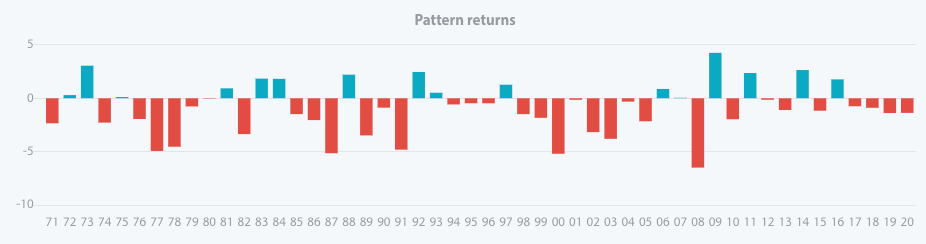
Most of the time, it went down sharply. Source: Seasonax
As you can see, most of the bars point downwards. In 34 of the 50 cases, the US Dollar fell until the end of the year. Noticeably, this has also been the case for the past four years. On average, a decline of just under 1% was moderate, as is usual for currency markets.
The seasonal course of the US Dollar Index in detail
But what does the seasonal pattern look like in detail? The seasonal chart below shows the typical pattern of the US dollar in the course of a calendar year for this purpose. It has been calculated as the average of the returns generated over the past 50 years. The horizontal axis shows the time of the year, the vertical axis the level of the seasonal index. Thus one can discern the US dollar’s seasonal pattern in the course of a calendar year at a glance.
US-Dollar Index, seasonal pattern over the past 50 years
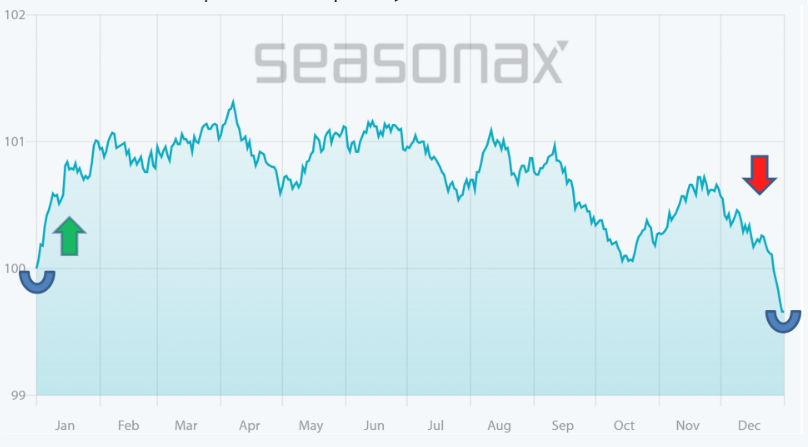
There is a trend reversal in the USD Index right at the turn of the year. Source: Seasonax
As can be seen, there is a seasonal decline in the USD Index as the end of the year approaches. It loses ground particularly quickly in the second half of December. Thereafter, it typically appreciates again in January (turning point highlighted in the chart).
If you look at the chart closely, you can see that the trend reversal occurs right at the turn of the year. This is quite conspicuous – there has to be a reason for it!
The reason for US dollar weakness at the end of the year
The fact that the trend in the US dollar reverses precisely at the turn of the year already provides a strong hint regarding the reason for this seasonal pattern: it has to be related to the end of the calendar year. What happens at that point in time? It is the balance sheet date!
The weakness in the US dollar at the end of the year is driven by US tax legislation. Many US-based companies save on their tax liabilities by reporting small amounts of cash at the balance sheet date at the end of the year. It can be worthwhile to shift money to the accounts of overseas subsidiaries.
The resultant additional demand for foreign currencies affects the exchange rate. This is why the US dollar typically declines at the end of the year.
After the turn of the year, the tide immediately turns. Companies transfer sizeable amounts back to the US.
Thus there is a solid fundamental reason for the pattern in the US dollar at the end of the year. It is driven by tax-related strategies of US companies.
Take advantage of seasonal opportunities!
However, what is the situation with individual currencies specifically?
If you want to find out, navigate to www.seasonax.com! There you can quickly examine the seasonality of individual currencies – or of any other instrument you are interested in – along with overviews of pattern returns in individual years.
Yours sincerely,
Dimitri Speck
Founder and Head Analyst of Seasonax
PS: Seasonality also exists in the Forex market!