Dear Investor,
We are proud of the fact that Seasonax made the cut into Bloomberg Global Macro Overview Q4 2017! Enjoy reading: ”The Quaterly Q4/2017“
Written by Oliver Woolf, CAIA, CMT, FRM, technical analysis specialist at Bloomberg LP.
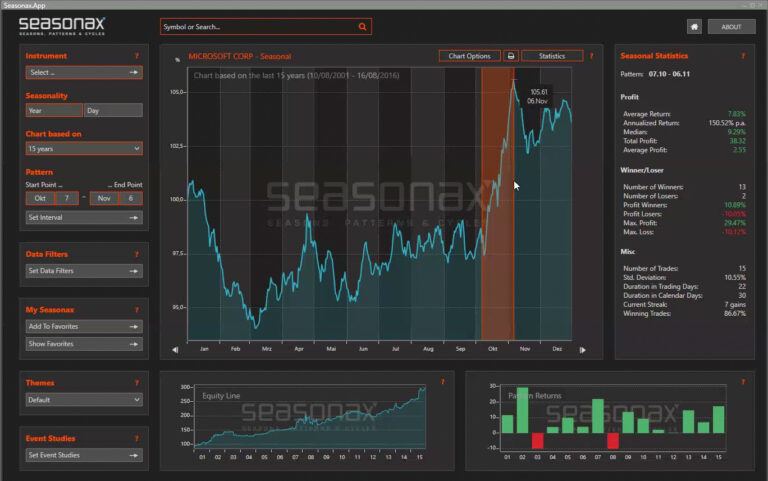
The chart below exhibits a strong Q4 seasonal pattern in the Bloomberg Commodity Index using the Seasonax App which is available in the Bloomberg App Portal at APPS.

The main chart in the image below shows the average annual performance based on a log return. This chart seems to imply a strong seasonal downtrend for commodities in Q4. Selecting this period of the chart (highlighted in blue) provides analysis on a strategy that would have only invested during this period of the year. The statistics table on the right shows that this strategy would have seen a mean annual decline of 2.62% in the BCOM Index which becomes 16.42% annualised. And the hit ratio is over 2:1 as the Index declined 18 times versus 8 gains. These statistics are visually summarised in the charts below. The bottom left cumulative return chart highlights how steady this return would have been.
The App can also be used for intraday optimisation.

The chart on the right depicts the average intraday performance of the BCOM index over the last 137 trading days. The section selected in blue highlight a period of strong negative movement which is from 17:20 – 17:40. there have been 83 declines in this period to 53 gains and the annualised decline equates to 1.41%