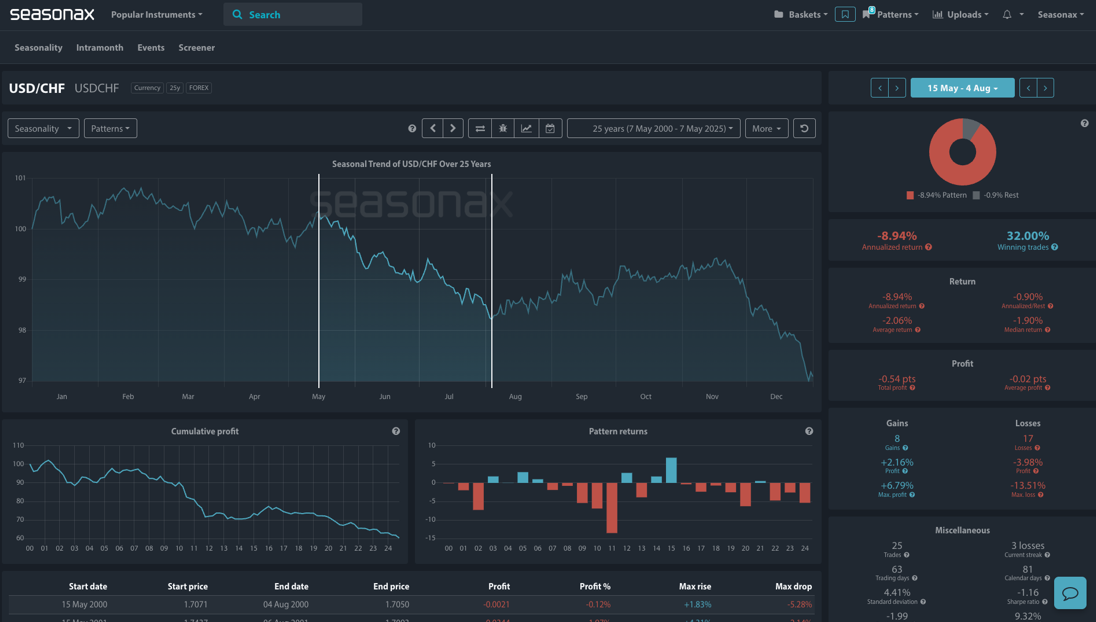
- Instrument: USD/CHF
- Average Pattern Move: -2.06%
- Timeframe: May 15 – August 4
- Winning Percentage: 32.00%
Dear Investor,
You may not realize that USD/CHF has a pronounced seasonal tendency for weakness through late spring and summer — a pattern that could come into sharper focus as the pair approaches key resistance. With the next major U.S. inflation and central bank decisions looming, we want to analyze the data in more detail.
The chart shows you the typical development of USD/CHF over the 25-year period from May 15 through August 4. Over this stretch, USD/CHF has declined with an average move of -2.06% and only an 32% win rate. The cumulative profit curve points to persistent downside pressure during this period, and the pattern returns highlight a string of losses that tend to accelerate from late June.
Technical Perspective
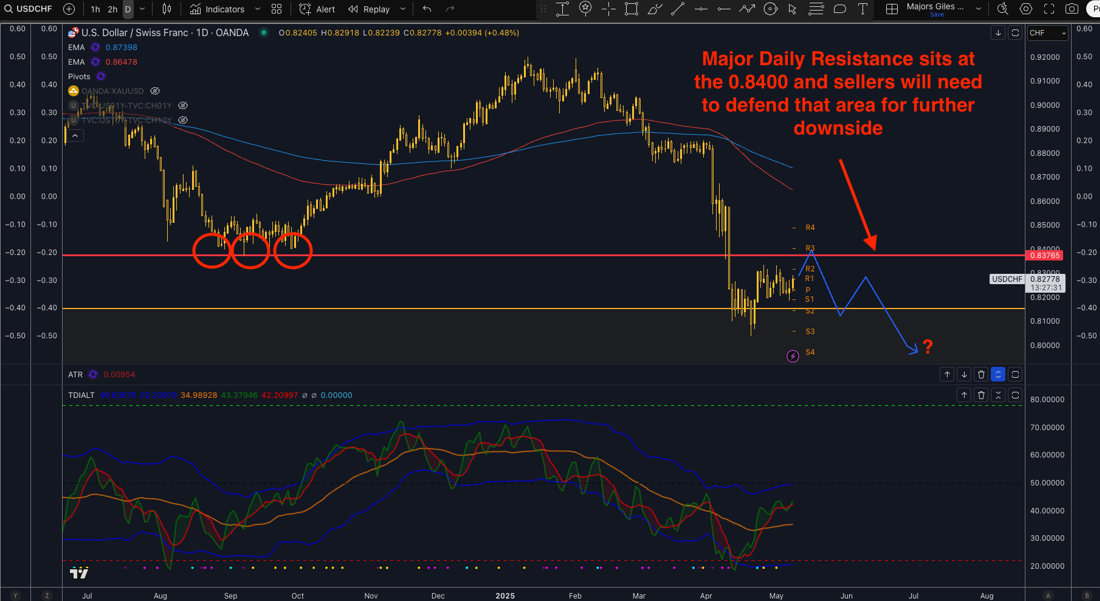
Technically, watch for the pair to press against major resistance near 0.8400 — a level marked by a prior triple bottom breakdown from Q3 2024. As highlighted on the chart, sellers will need to hold that line for any continuation lower, but the seasonal bias suggests there may be renewed downside momentum building as we head deeper into May and June. A break below 0.8000 could open the door to deeper losses, but be aware this is a large monthly support zone.
Trade Risks:
The primary risk is a fundamental shift in U.S. or Swiss policy expectations. If the Federal Reserve delays rate cuts or the Swiss National Bank move to formally embrace negative interest rates, USD/CHF could break through resistance and invalidate the seasonal bias. Always monitor for significant macroeconomic catalysts.
Use Seasonax for your professional handling of market-moving events!
Don’t just trade it, Seasonax it.