- Instrument: Tyler Technologies, Inc. (TYL)
- Average Pattern Move: +10.24%
- Timeframe: 16 June – 10 September
- Winning Percentage: 90.00%
Dear Investor,
You may not realize it, but Tyler Technologies has one of the most consistent and overlooked seasonal uptrends in the entire tech space. With a stunning 90% win rate over the last 20 years, the company’s shares have historically delivered robust gains from mid-June through early September.
We want to analyse the data in more detail.
The Numbers Speak
The 20-year Seasonax pattern shows TYL averaging a +10.24% return between June 16 and September 10, with 18 out of 20 years closing this window in the green. The cumulative profit curve points to steady, almost linear gains, with especially strong performance in the last two weeks of August.
This is not a high-beta tech rocket. It’s a steady institutional favorite with surprisingly low downside variance: the maximum drawdown in this pattern is only -4.78%, with a standard deviation of 9.03%, well below other software peers.
Why This Matters Now
As investors rotate between AI-hyped names and more defensive tech, Tyler stands out for a very different reason: reliable government SaaS contracts. The company’s strategic pivot to software-as-a-service (SaaS) and transaction-based models has positioned it as a leader in public sector technology solutions. In Q1 2025, SaaS revenue grew by 21% year-over-year, driven by the addition of new SaaS. This recurring revenue engine not only stabilizes cash flows but also positions Tyler to capitalize on long-term government and public-sector IT modernization trends.
With US infrastructure spending continuing and municipalities ramping up digital transition efforts, the seasonal tailwind coincides with strong structural tailwinds. You might be watching Nvidia, Apple, and the Nasdaq closely this summer, but don’t ignore the quiet performers. Tyler Technologies has a remarkable record of steady seasonal gains. For portfolio managers looking for tech exposure with lower volatility, TYL fits the profile.
Technical Perspective
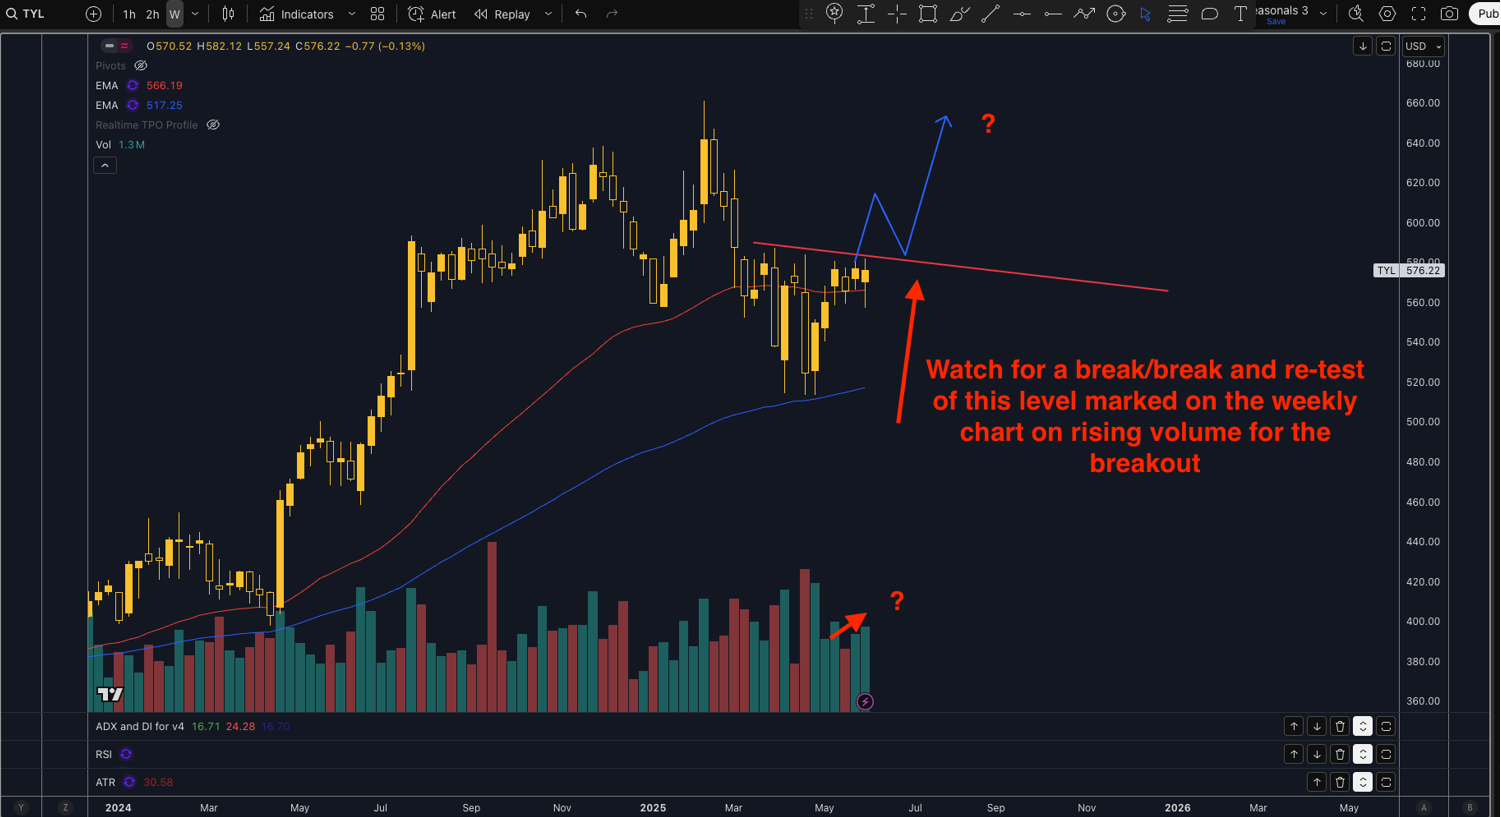
Technically, watch for a break of the 579 weekly resistance zone marked below on rising volume. If price has already broken out of that level then look for a retest of the broken trend line on lower volumes. Risk can be nicely defined under the 550 level for breakout buyers.
Trade Risks
Any surprise drawdowns in public sector budgets, delays in project execution, or margin compression from slower SaaS renewals could weigh on shares. Monitor government funding signals and competitive SaaS pricing trends closely.
Use Seasonax for your professional handling of market-moving events!