
- Instrument: Procter & Gamble (PG)
- Timeframe: June 18 – September 15
- Average Pattern Move: +26.61% annualized
- Winning Percentage: 90.00%
Dear Investor,
You may not realize that while markets often churn through low summer volume and macro event risk, Procter & Gamble has delivered one of the most consistent seasonal rallies of any major US stock. With a 90% win rate over the past 20 years and an average annualized return of +26.61%, this consumer staples giant has historically been a quiet overachiever from mid-June through mid-September.
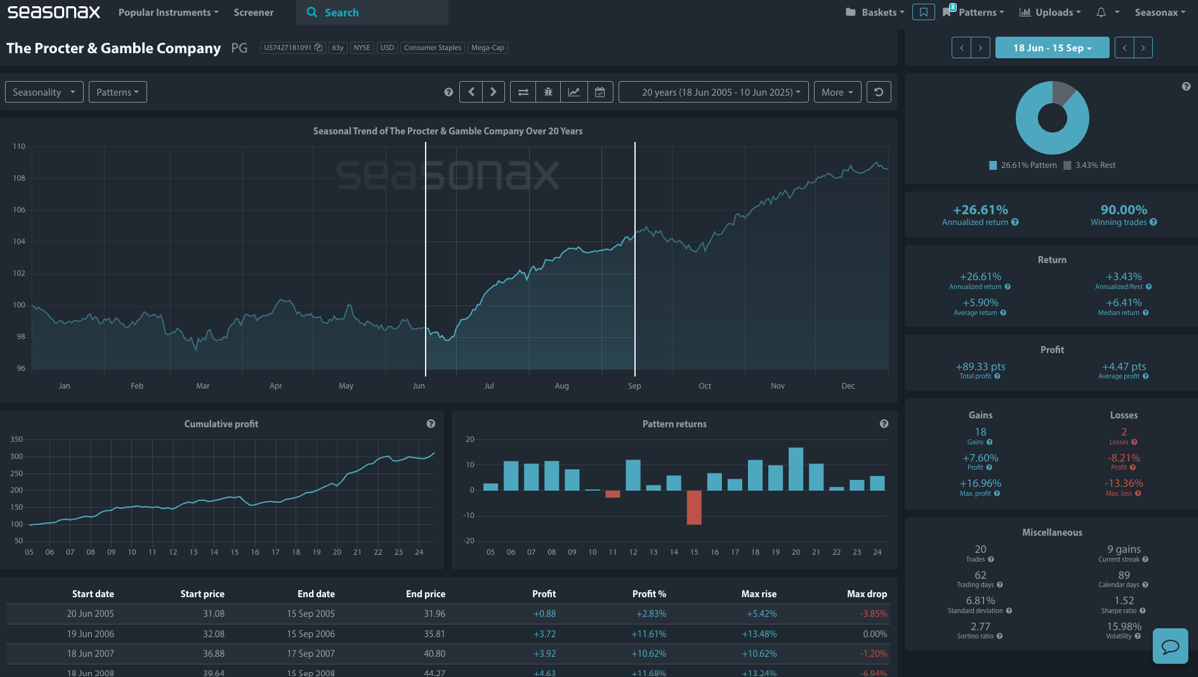
Let’s analyze the data in more detail. From June 18 to September 15, PG has closed higher in 18 of the past 20 years. The typical move over this stretch is +5.9%, with gains frequently clustering above +10% in stronger years. The median return over the same period is even better at +6.41%, highlighting the consistency of this trend. This strong seasonal pattern is further supported by low volatility: PG’s Sharpe ratio during this period is 1.52, and the Sortino ratio sits at 2.77, confirming that the risk-adjusted return profile is compelling for defensive investors.
These returns are particularly notable considering they occur during a stretch that often coincides with weaker seasonality in equity markets more broadly — a time when defensiveness and dividend yield often become more attractive.
Defensive Rotation and Dividend Appeal
In macro environments marked by policy uncertainty, risk-off swings, or rotation away from tech and cyclicals, staples like Procter & Gamble often shine. The company’s combination of steady earnings, global consumer reach, and reliable dividend income makes it a favored name for yield-focused investors and large institutional portfolios during calmer months.
With recent data still pointing to soft-landing optimism but lingering geopolitical and fiscal risks, it wouldn’t be surprising to see capital rotate back into staples — and PG has the seasonal track record to support that thesis.
Technical Perspective
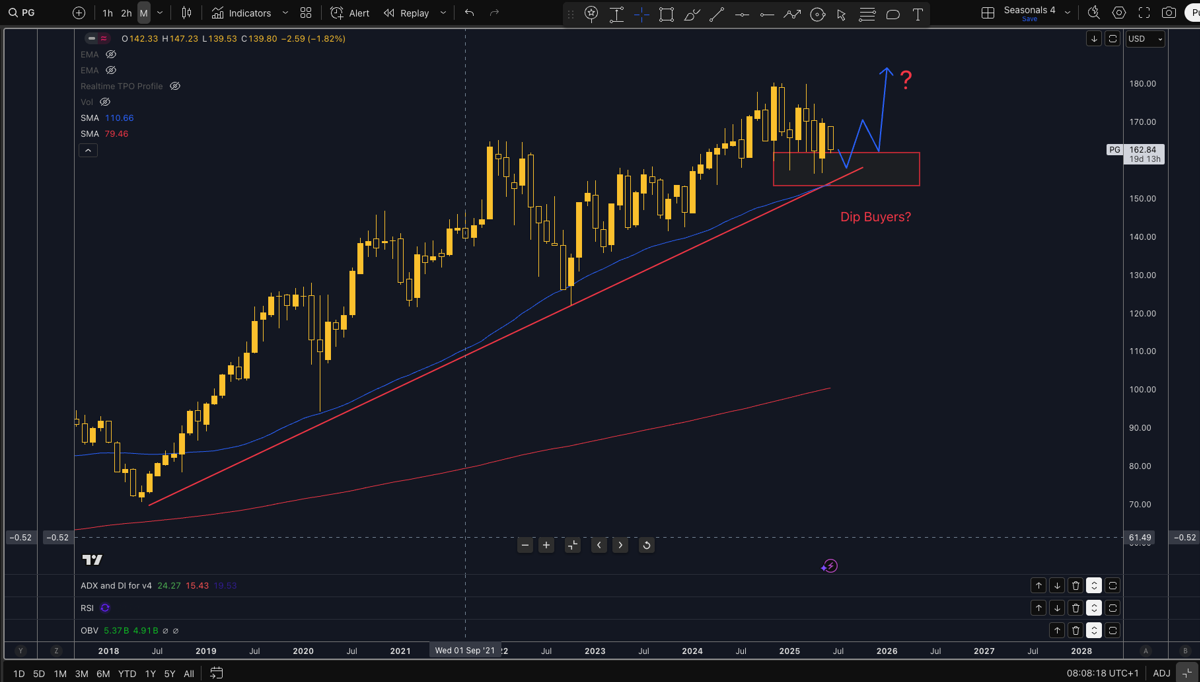
Procter & Gamble remains in a strong multi-year uptrend with a clear pattern of higher highs and higher lows since 2016. Despite some recent consolidation, the long-term structure remains bullish. Price recently pulled back into a strong confluence support zone marked by the 50-month EMA (currently around $151–153) and an ascending trend line connecting the 2018 and 2020 swing lows. This cluster is now acting as a base for potential dip buying — a classic area where institutional flows tend to re-enter long positions. A clean hold above the 50EMA and red box structure would favor a resumption of the uptrend, with a possible re-test of the $170–180 zone in Q3.
Trade Risks
As always, investors should stay alert to unexpected earnings surprises, changes to consumer sentiment, or sudden rotation back into risk assets. Additionally, any deterioration in US labor or inflation data that reshapes rate expectations could shake confidence in staples temporarily.
Use Seasonax for your professional handling of market-moving events!
Procter & Gamble’s summer strength is one of the most consistent seasonal patterns in US equities. If history is any guide, this could be a name to lean on as we move deeper into the warmer months.
Analyze this stock and over thousands more for free! Try it for 30 days for free!