
- Instrument: S&P 500
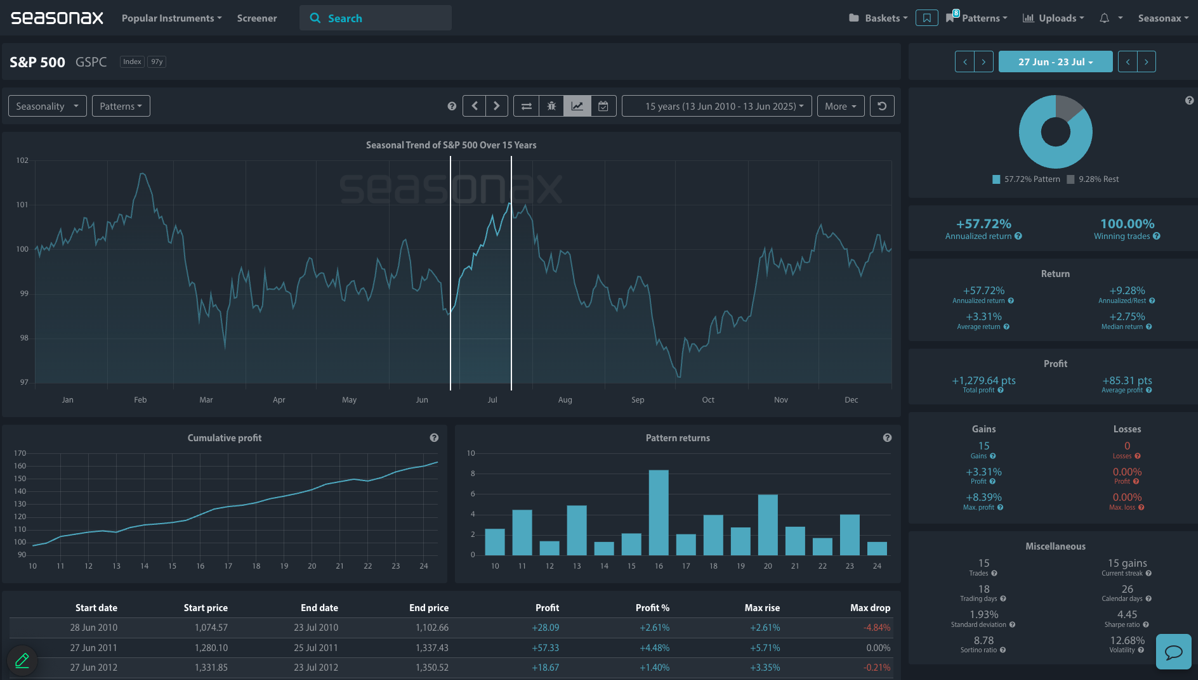
- Average Pattern Move: +3.31%
- Timeframe: 27 June – 23 July
- Winning Percentage: 100.00%
Dear Investor,
You may not realize that the S&P 500 has historically delivered an almost flawless rally into midsummer. With Q2 earnings season ramping up and positioning light following midyear rebalancing, late June to July has often rewarded equity bulls. This year, we want to analyze the data in more detail.
The chart below shows you the typical development of the S&P 500 between 27 June and 23 July over the past 14 years. The pattern is striking: a 100% win rate, +3.31% average return, and a Sharpe ratio of 4.45 make this one of the most robust seasonal stretches in US equity markets.
This pattern tends to coincide with bullish investor psychology ahead of major earnings beats, particularly from mega-cap tech stocks that have dominated recent years and positioning ahead of Amazon, Apple, Microsoft, and Nvidia earnings has added to this upward seasonal drift. At a time when macro uncertainty remains elevated—from sticky inflation to global geopolitical stress—this summer resilience may come as a surprise. However, the equity market often climbs the wall of worry when expectations are subdued.
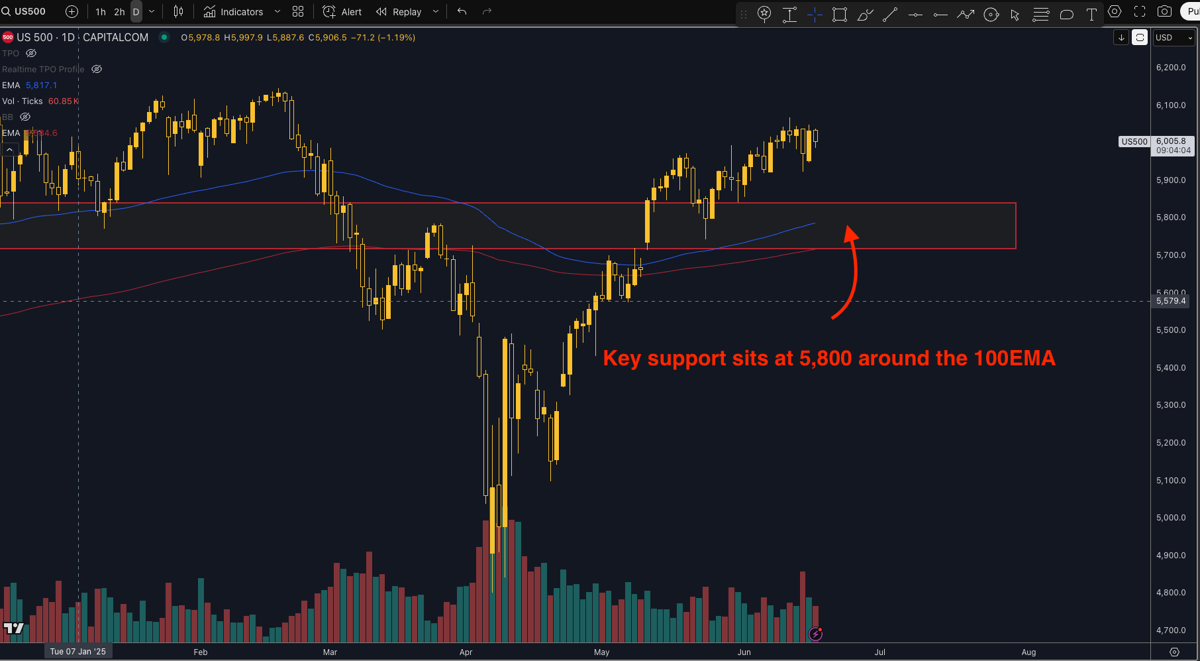
Technical Perspective
Technically, major support sits at 5,800 and any key signals to go long from that region could offer a potentially great place for bulls to look for longs in line with the seasonal strength.
Trade Risks
While the seasonal edge is strong, the outlook remains subject to event risk around inflation surprises or hawkish Fed messaging. Any escalation in geopolitical tensions (e.g., in the Middle East or South China Sea) could also drive risk aversion. A failure in earnings to justify high forward multiples would likewise cut the legs from this rally window.
Use Seasonax for your professional handling of market-moving events!