


The United States is a Consumer Nation
Black Friday stocks by the numbers: the S&P 500 was up in 21 of 25 periods around the shopping day. See how Walmart, Costco and Macy’s did around Thanksgiving and which time windows matter.
Black Friday stocks by the numbers: the S&P 500 was up in 21 of 25 periods around the shopping day. See how Walmart, Costco and Macy’s did around Thanksgiving and which time windows matter.

Stocks rise around the U.S. midterms: From five days before to two days after the election, the S&P 500 has risen in 22 out of 23 cases since 1934. View the charts and learn how to test this pattern yourself using Seasonax’s Event feature.
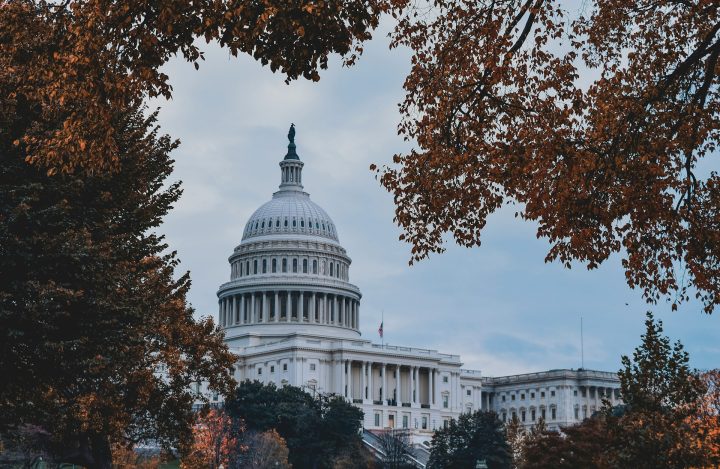
The S&P 500 has historically started moving before midterm election results are even known. Seasonax data going back almost a century shows a seasonal window with an 87.50% win rate, and exactly when it starts to fade.

The year-end rally often begins earlier than the media reports. A look at 66 years of DAX data and 98 years of S&P 500 data shows when opportunities really start to increase.

The next phase of AI is being built in data centers, chip manufacturing and power grids. Q2 seasonal patterns across Nvidia, Broadcom and NextEra Energy suggest this infrastructure buildout has historical tailwinds behind it.

The S&P 500 often slows in March after strong early-year gains. Over the past 15 years, returns have been flat and volatility has picked up mid-month. But history shows momentum tends to improve from April through June, marking a clear seasonal shift.

Historical data suggest that recurring seasonal patterns emerge around major sporting events and the decennial cycle. These patterns point to recurring shifts in market behavior at certain times of the year, offering a structured way to analyze historical market tendencies.

The year-end rally on the stock markets has already begun! The DAX and S&P 500 have statistically shown strong performance from mid-November to early January. Historically, there have been many positive years with attractive returns. A good time to keep a close eye on the markets.
The US election influences stock prices even beyond election day. For the markets, the year of the four-year election cycle we are in is crucial. In the current post-election year, seasonals suggest a stronger upcoming seasonal decline.
Did you know the S&P 500 has never lost between June 27 and July 23 over the past 14 years? With an average gain of 3.31% and a Sharpe ratio of 4.45, this seasonal stretch stands out as one of the most reliable in the US equity market. As earnings season heats up, mega-cap tech stocks often act as a catalyst for midsummer momentum.
Historically, the S&P 500 has shown an upside bias after Non-Farm Payrolls (NFP) releases, with an average return of +0.17% in the following 10 days. With Fed Chair Powell’s cautious stance on rate cuts, this NFP report could be pivotal for market trends.

