
- Instrument: Amgen
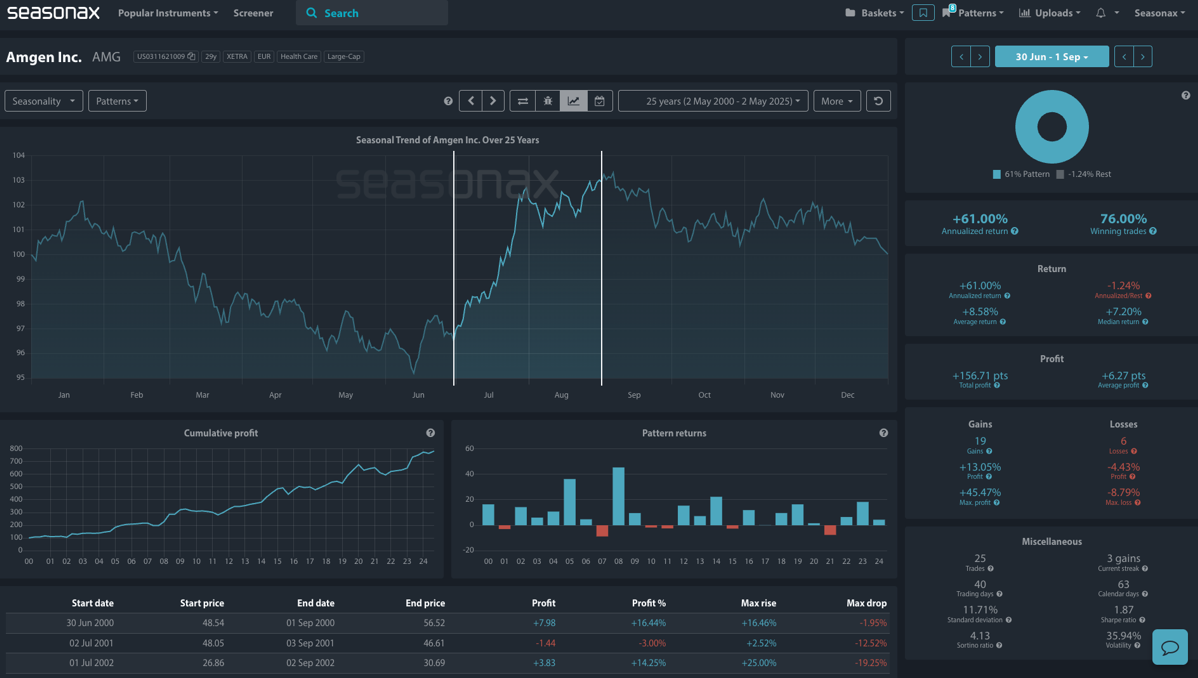
- Average Pattern Move: +8.58%
- Timeframe: 30 June – 1 September
- Winning Percentage: 76.00%
Dear Investor,
You may not realize just how strong Amgen’s seasonal pattern is around this time of the heat. A large cap health stock Amgen can find significant gains as we head into the summer months. We want to analyze the data in more detail.
The chart below shows you the typical development of Amgen prices from 30 June to 1 September over the last 25 years. It reveals a compelling seasonal window of strength, with average returns of +8.58% and a 76% win rate. This strong bias higher stands out and as a health stock, any significant concerns about the ongoing state of the US economy can see investors move into defensive health care stocks. The rationale behind this is that consumers still prioritize health care needs, even when other expenditure is cut.
In its last earnings report Amgen’s adjusted earnings were $4.90 per share in the first quarter, surpassing analysts’ average estimates of $4.25 per share.
Of note was that Amgen’s obesity treatment, MariTide, is in the final stage of clinical trials and is expected to hit the market in 2027, with further data from an earlier trial to be presented later this year. Could this lead to further upside into the summer months?
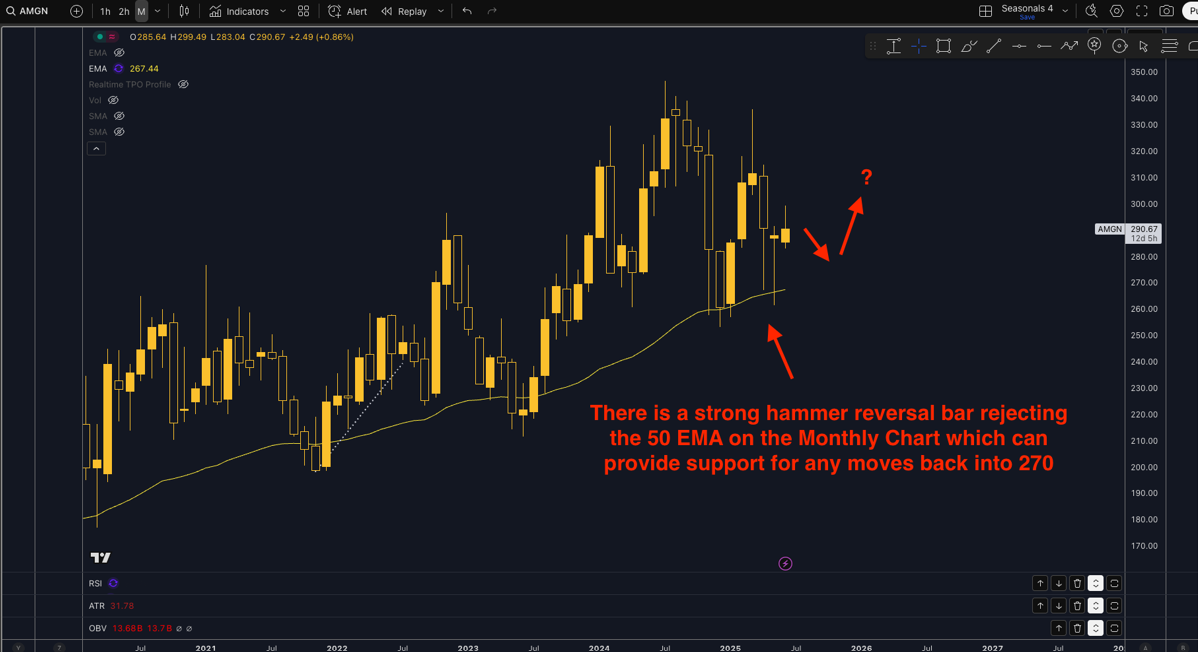
Technical Perspective
Technically, there is strong support around the 270 region and the strong monthly hammer reversal bar rejection of the 50 EMA. Stops can be tight under 255 level to manage risk.
Trade Risks
Previous seasonal patterns are not guarantees of future moves and Amgen’s latest health drug trial my disappoint investors and send the stock lower. Also, note that there has been large drawdowns of nearly 20% with this seasonal pattern, so volatility is pronounced.
Use Seasonax for your professional handling of market-moving events!