Dear Investor,
Microsoft became the second company in the world to surpass a $4 trillion market cap this summer, propelled by a blockbuster earnings report and renewed investor confidence in its AI leadership. But as we move into mid-September, one of Microsoft’s weakest seasonal windows begins. With the stock extending this summer, up to more than 60% since its April low, could it now be due for a further breather?
- Instrument: Microsoft Corp. (MSFT)
- Average Pattern Move: –1,94 %
- Timeframe: 15 September – 2 October
- Winning Percentage: 26,67 %
Let’s examine the seasonal pattern in more detail.
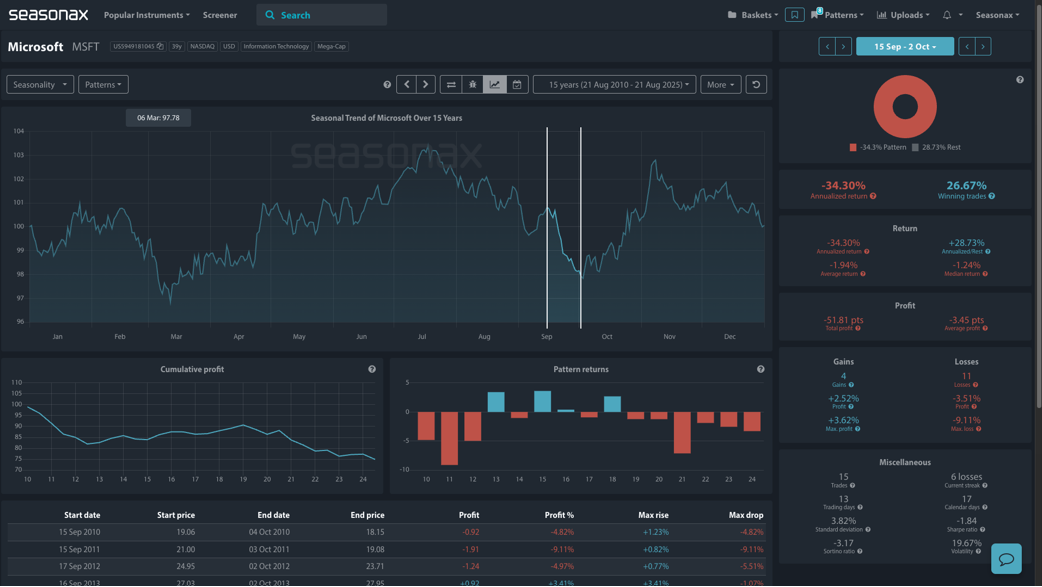
The detrended seasonal chart below shows that over the last 15 years, Microsoft shares have historically delivered an average loss of –1.94% between 10 September and 3 October, with a low 26.67% win rate. Seasonax’s detrended chart removes overarching trends, allowing us to see that this period has produced losses in 11 of the last 15 years, even during strong years for tech. It’s a caution worth noting—especially when the fundamentals appear overwhelmingly positive.
Seasonal Chart of Microsoft over 15 Years
Macro Focus: Blowout Results, Sky‑High Expectations, and a Heavyweight Index Role
Microsoft’s Q2 earnings results smashed expectations:
- Microsoft’s Azure cloud revenue rose 39%, above forecasts
- Capital expenditure is expected to top $30 billion in Q1
- Full-year revenue guidance is in double digits, with robust AI infrastructure spend underway
When announced, at the end of July, these numbers sparked a rally of more than 8% in a single session, catapulting Microsoft above the $4 trillion mark and pushing the Nasdaq 100 (where Microsoft holds a 12.46% weighting) to new highs.
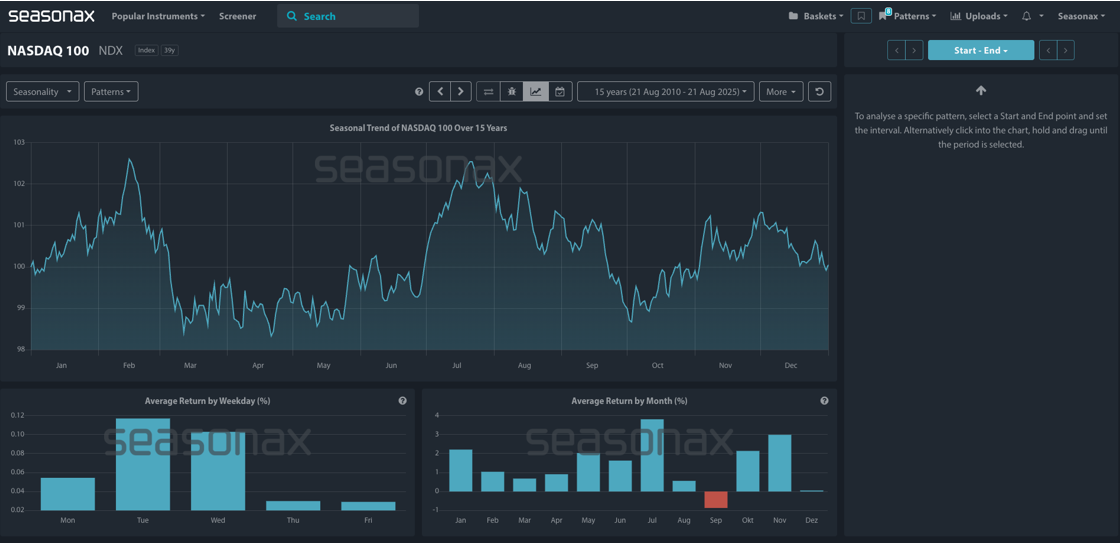
But this rally comes with elevated risks. The broader Magnificent Seven stocks have led the market higher in recent months, and with momentum now stretched, even strong performers like Microsoft could be vulnerable to a further pullback—particularly when history suggests this is a seasonally weak stretch. Note below that the only month the Nasdaq has a negative average return in the last 15 years has been during the month of September (see the only red bar on the bar chart below).
Seasonal Chart of the NASDAQ 100 over 15 Years
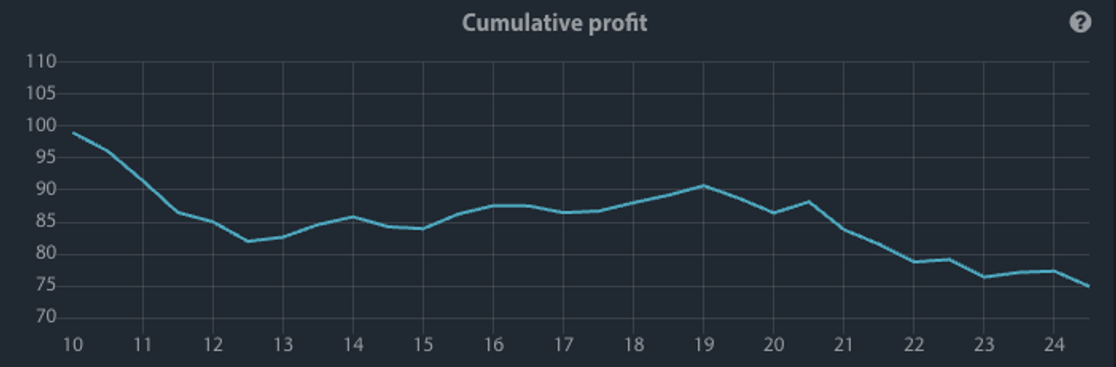
Furthermore, Seasonax’s cumulative profit curve for this time period confirms the risk for Microsoft. The cumulative return curve shows the total result of buying Microsoft in this window each year over the 14-year history – and the picture is clearly a negative drift lower.
Cumulative Profit Curve of Microsoft between September 15 and October 02
Technical Picture: Signs of Overextension Appear
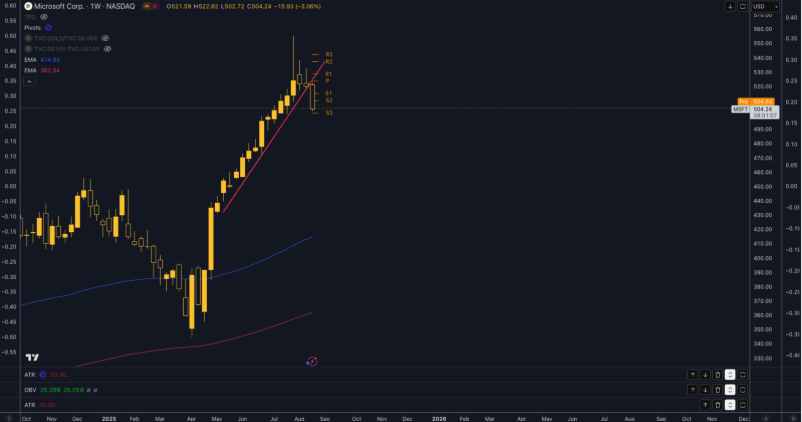
From a technical perspective, Microsoft is now trading significantly above its 100 (blue line) and 200‑day (red line) EMAs. However, the post earnings surge up to 550 has clearly been rejected with clear tailing price action shown on the weekly chart. Moreover, the weekly trend line (marked red) has also been broken lower on a clear momentum change in the middle of August suggesting a potential near term trend change that could potentially be underway, which would also coincide with a weak seasonal period ahead. The key area to watch for sellers would be any selling from the $520 region with a potential re-test of the underside of the broken trend line a likely catalyst for short term sellers.
Conclusion: Stellar Execution, But Caution Warranted
Microsoft’s long-term growth story remains intact. But in the short term, this seasonal window has historically delivered poor performance. With the stock up sharply and optimism running high, traders should remain alert for signs of reversal, especially if bond yields rise or a surge on US inflation or further profit-taking kicks in.
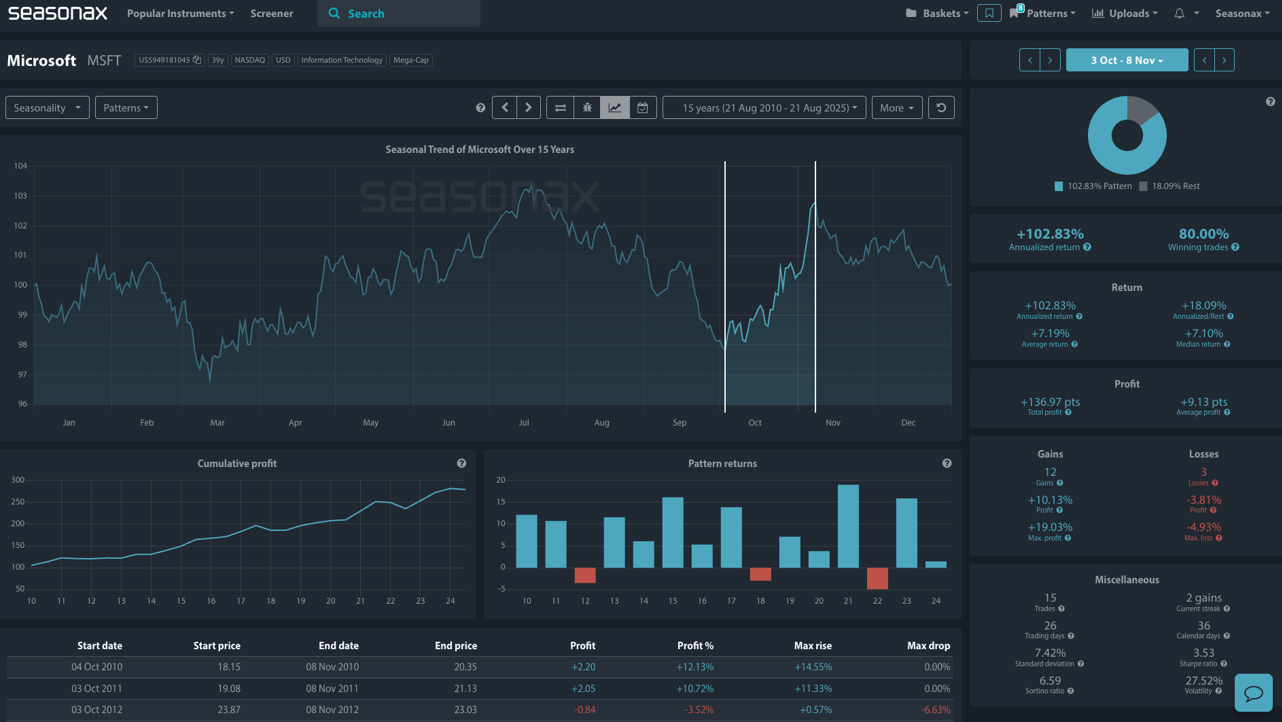
A more conservative approach for those reluctant to be a seller might be to wait for a pullback, in line with the seasonal dip, and look to re-enter as we head into October. Microsoft’s return in October has been an impressive average of 7.19% over the last 15 years between October 03 and November 08. As always, use protective stops and consider the broader context – Microsoft is a leader in AI, but even leaders need to rest. However, seasonality shows you that there can be a multi-dimensional approach to using seasonality in your trading.
Seasonal Chart of Microsoft over 15 Years
Use Seasonax for your professional handling of market-moving events to find stocks
poised to move!
Yours sincerely,
Giles Coghlan, CMT
Macro Strategist Seasonax