
Dear Investor,
Since the low point in April, stocks related to AI have seen particularly strong price increases. These include companies such as Nvidia, AMD, and Broadcom.
Many investors are wondering what will happen to the share prices now.
You can read about the fundamental development or strategic direction in the media.
Though you should consider seasonal patterns as well.
One stock stands out in particular: Broadcom.
Broadcom’s annual review
Take a look at Broadcom’s seasonality. The chart shows you Broadcom’s seasonal pattern over the past ten years.
Broadcom’s 10-year seasonal trend.
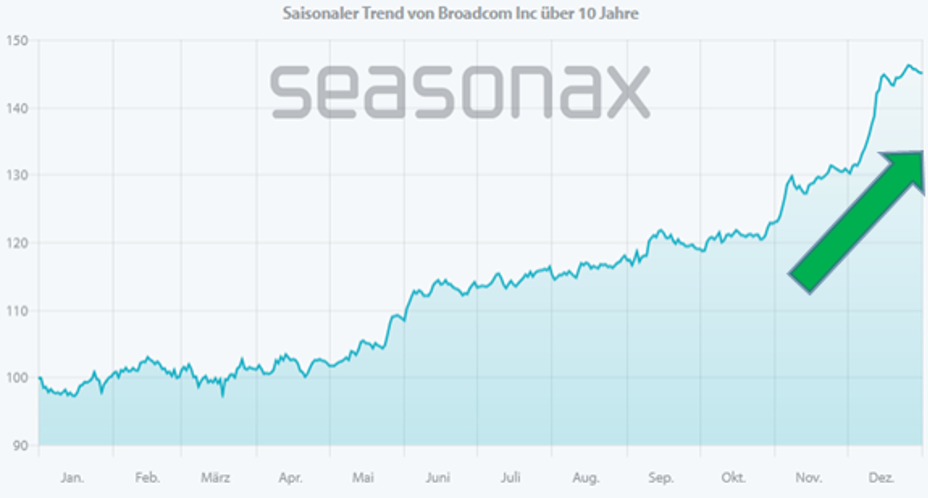
As you can see, Broadcom stock exhibits a pronounced seasonality. It experiences a particularly steep seasonal rise before the turn of the year, with the steepest seasonal increase occurring in the first half of December.
I have marked the best period for you with an arrow. It begins on November 3rd and ends on December 15th.
During this period, Broadcom’s share price rose by an average of 17.10 percent, which translates to a high annual increase of 294.74 percent.
The success rate has been a good 90 percent over the past ten years.
For comparison: During the remaining period from December 15th to November 3rd, Broadcom’s annualized growth averaged only 23.56 percent.
The large difference of 294.74 percent to 23.56 percent shows you how good this seasonal phase is for Broadcom starting in November.
Even high-flyers have seasonal patterns
You can see that even high-flying stocks with high overall performance exhibit strong seasonal patterns.
In practice, it can be helpful to “detrend” the seasonal chart. Detrending means removing the overarching upward trend. The last value on the chart then aligns with the initial value. This makes the seasonal trend even clearer.
The next chart shows you the detrended seasonal trend of Broadcom.
10-year detrended seasonality of Broadcom
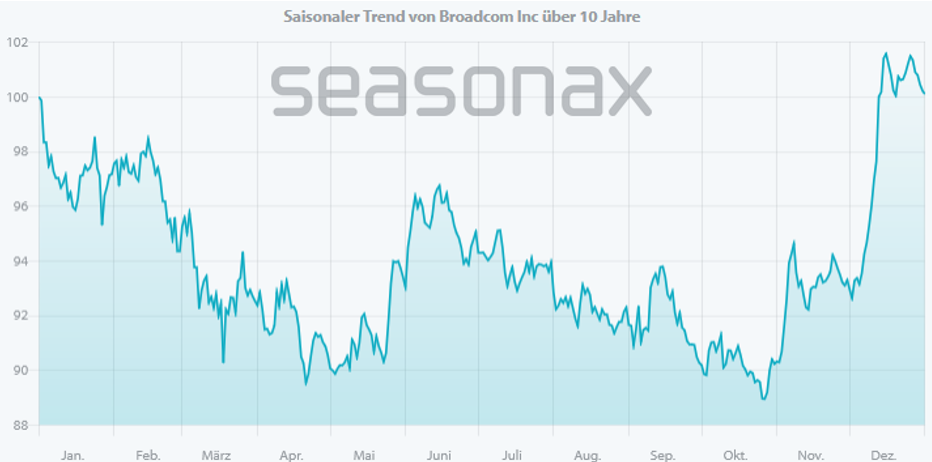
As you can see, detrending visually reinforces the seasonal trend.
In the first half of December, the line rises almost vertically. Incidentally, you can easily turn detrending on and off in Seasonax by clicking the button with the arrow symbol above the chart:
Detrending button in Seasonax

In the detrended chart, you can see the seasonal trend more clearly.
In the normal seasonal chart, you can directly read the average performance in percent that the instrument has achieved in recent years.
Both the normal seasonal chart and the detrended chart have their place.
Simply use both. You can switch between them with a quick click!
Warm regards
Dimitri Speck
Founder and Chief Analyst of Seasonax
PS: Take advantage of Seasonax’s comprehensive charting features, such as detrending!