Dear Investor,
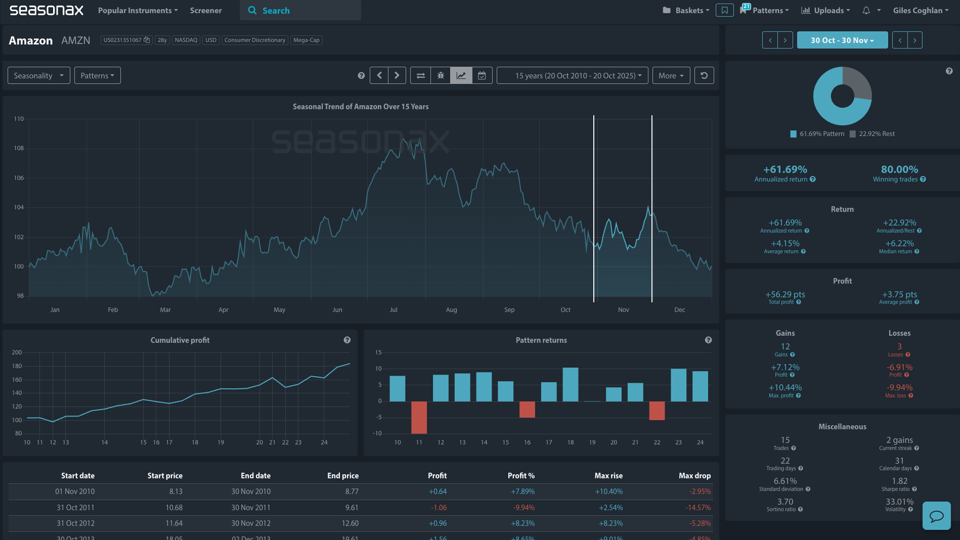
Amazon is about to enters one of its strongest trading windows just as it faces renewed questions about AWS dominance, competitive pressures, and service reliability. Amazon will announce its earnings on October 30th just as this strong seasonal pattern starts. From 30 October to 30 November, Amazon shares have posted an average gain of +4.15% over the past 15 years, with an impressive 80% win rate and a 61.69% annualized return.
- Instrument: Amazon.com Inc. (AMZN)
- Average Pattern Move: +4.15%
- Timeframe: 30 October – 30 November
- Winning Percentage: 80.00%
Let’s analyze the seasonal data in more detail.
The detrended seasonal chart below shows a consistent pattern of strength into mid-Q4, likely driven by post-earnings momentum, holiday optimism, and institutional repositioning. Out of the last 15 years, Amazon delivered gains in 12 of them, with a standout return of +10.44% during its best year in 2018.
Macro Focus: Earnings, Cloud Leadership and Rising Scrutiny
This year’s window is particularly interesting, as it intersects with a complex macro and company-specific backdrop:
- Q3 earnings are expected at the end of October, with investors focusing on AWS revenue growth, retail margins, and ad business performance.
- Holiday tailwinds should provide support, with Black Friday and Cyber Monday looming large.
- But the story isn’t all bullish. Amazon is under increasing pressure from cloud rivals, and a recent AWS outage has highlighted a vulnerability few expected.
Earlier this month, on October 20, you may be aware that AWS suffered its worst outage since 202. It lasted nearly 15 hours and impacted services from Apple and McDonald’s to Zoom, Snowflake, and even Amazon’s own Alexa and Ring systems. Though the company identified the issue and restored operations, the incident has revived fears about cloud centralization and the fragility of even the most trusted hyperscalers.
Cloud Wars: AWS Losing the Narrative?
Once seen as the undisputed cloud leader, AWS is now navigating a more crowded and competitive landscape:
- Microsoft Azure and Google Cloud have been aggressively capturing AI-related workloads.
- Oracle, once a peripheral player, is now signing massive AI infrastructure deals (including a reported $300 billion contract with OpenAI), and its cloud revenue is growing rapidly.
While AWS still commands the largest market share, Bloomberg Intelligence estimates it could shrink from 35% in 2022 to below 20% by 2030, with Microsoft expected to overtake it and Oracle potentially leapfrogging Alphabet.
That said, according to Goldman Sachs Research, the overall cloud market is expected to exceed $2 trillion by the year 2030. So, while Amazon may lose market share, its slice of the pie could still expand in dollar terms. Furthermore, Seasonax’s cumulative profit curve for this time period points to a historically resilient reaction to Q3 earnings. The cumulative return curve shows the total result of buying Amazon in this window each year over its 15-year history. The picture is clearly a drift higher.
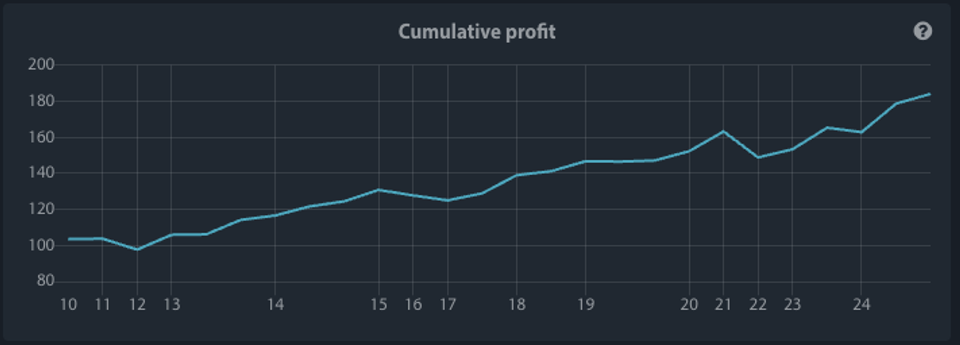
Source: Seasonax
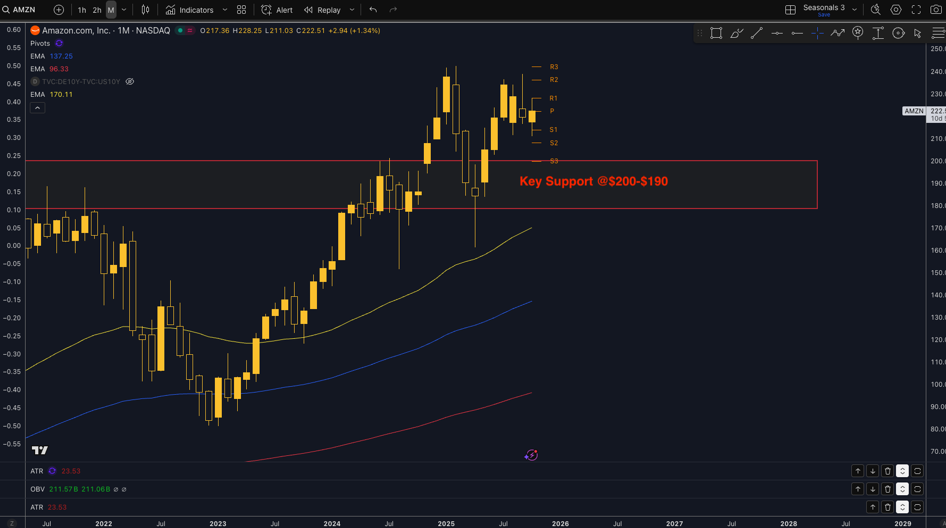
Technical Picture: Signs of Overextension Appear
From a technical perspective, Amazon is in an uptrend and trading significantly above its 50 (yellow line), 100 (blue line,) and 200‑day (red line) EMAs. Major support is marked at $200 on the chart below and that sits around 10% below price. Remember that Seasonax data shows that the largest drop during this seasonal period was -9.94% in 2011. Also note that the maximum drawdown was -15.91% in 2022, so a sharp fall into $200 post earnings may offer a great dip buying opportunity on a slightly softer earnings outlook.
Conclusion: Opportunity With a Caveat
Amazon’s seasonal pattern from late October into late November is strong, but this year, AWS’s reputation, competitive positioning, and investor sentiment around cloud valuations will matter more than ever.
Should earnings reassure (or at least not disappoint too much) and holiday trends hold up, the stock could benefit from a classic seasonal tailwind. A dip lower on disappointing earnings into the $200 region could offer traders a great way of positioning smartly for this seasonal pattern. Traders may want to wait for the earnings reaction before entering to avoid the event risk, but still take note of this seasonal pattern for potential post earning buying opportunities.
Use Seasonax for your professional handling of market-moving events to find stocks poised to move!
Yours sincerely,
Giles Coghlan, CMT
Macro Strategist Seasonax