
Dear Investor,
You may not be aware, but after a strong early-year performance, March often acts as a pause point for the US S&P 500 equity market.
The chart below shows that over the last 15 years, the S&P 500 has produced an average return of -0.09% during March, with an annualized return of -1.06%. While the winning percentage stands at 66.67%, the overall pattern is flat-to-soft, with cumulative performance showing a clear tendency to stall rather than extend higher.
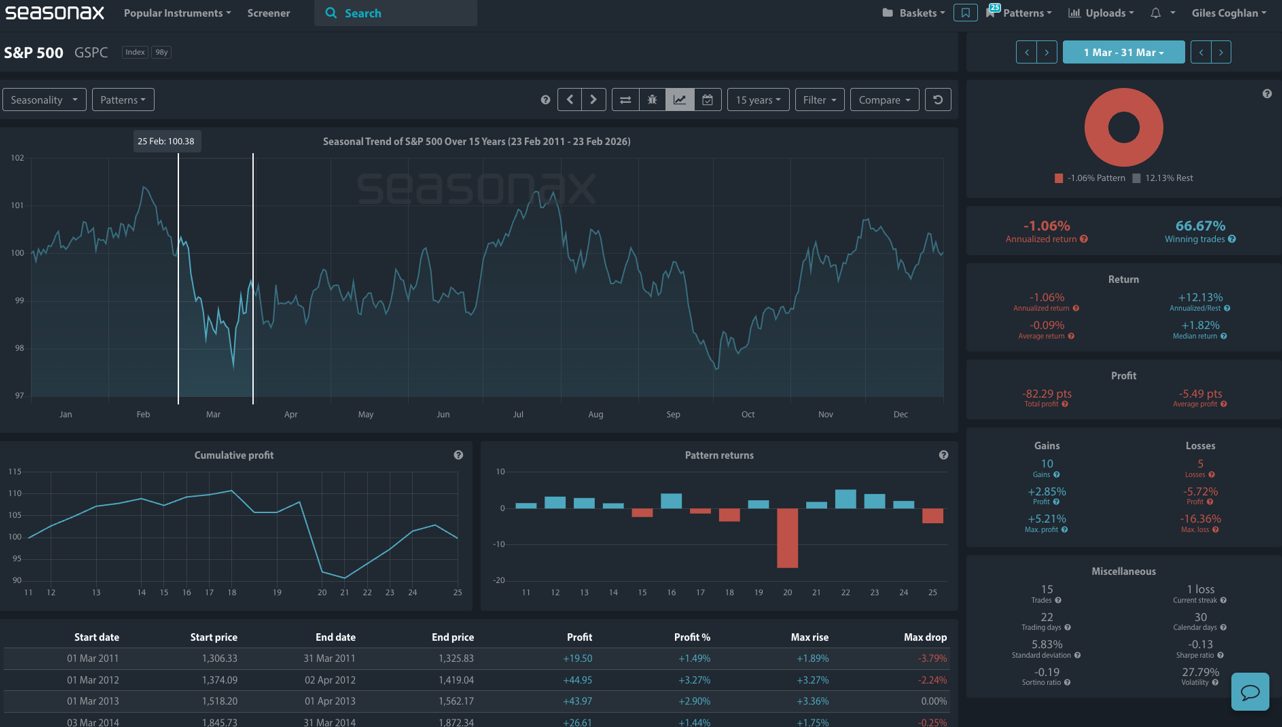
In other words: March has historically been a month for consolidation and not strong upside continuation.
March: A Seasonal Reset Month For The S&P 500
Looking at the broader monthly distribution over the past 15 years, March ranks among the weaker months for the S&P 500.
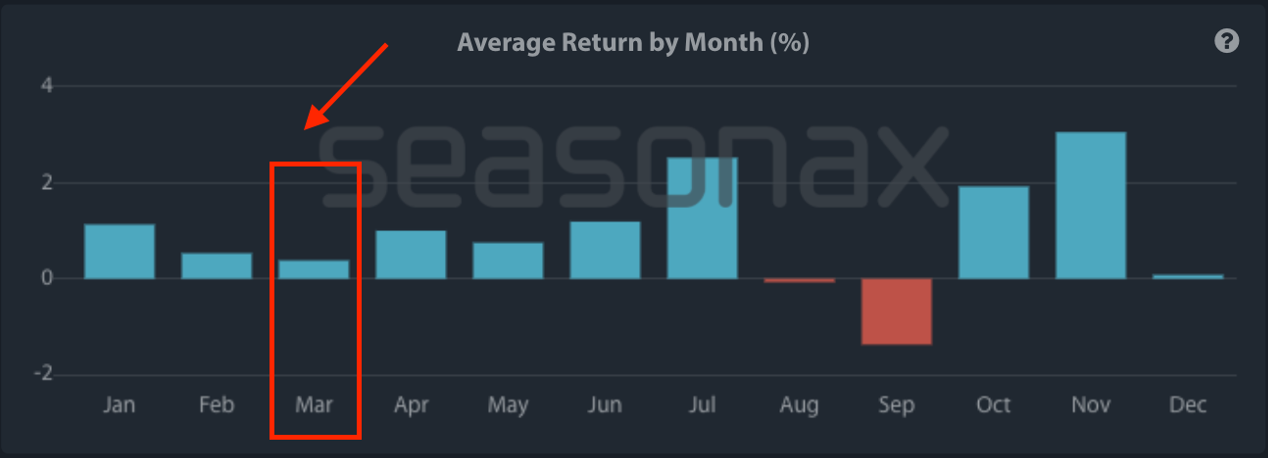
This is because several dynamics tend to converge:
- Q1 positioning adjustments as portfolio managers adjust the balance of their bond and equity allocations.
- Earnings blackout periods ahead of April reporting
- Policy uncertainty around Fed meetings
- Pre-tax season liquidity effects. Ahead of the mid-April US tax deadline, investors and corporations often raise cash to meet tax payments, which can temporarily reduce market liquidity and dampen buying momentum in March.
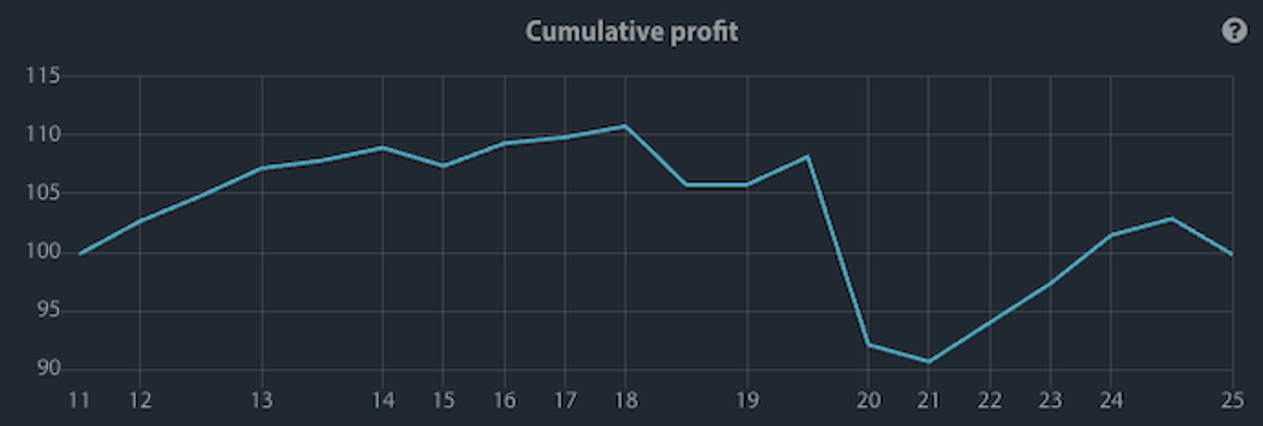
The cumulative profit curve for March below highlights this hesitation clearly – gains are often made early in the month (left-hand side of the chart below) before volatility picks up mid-to-late March.
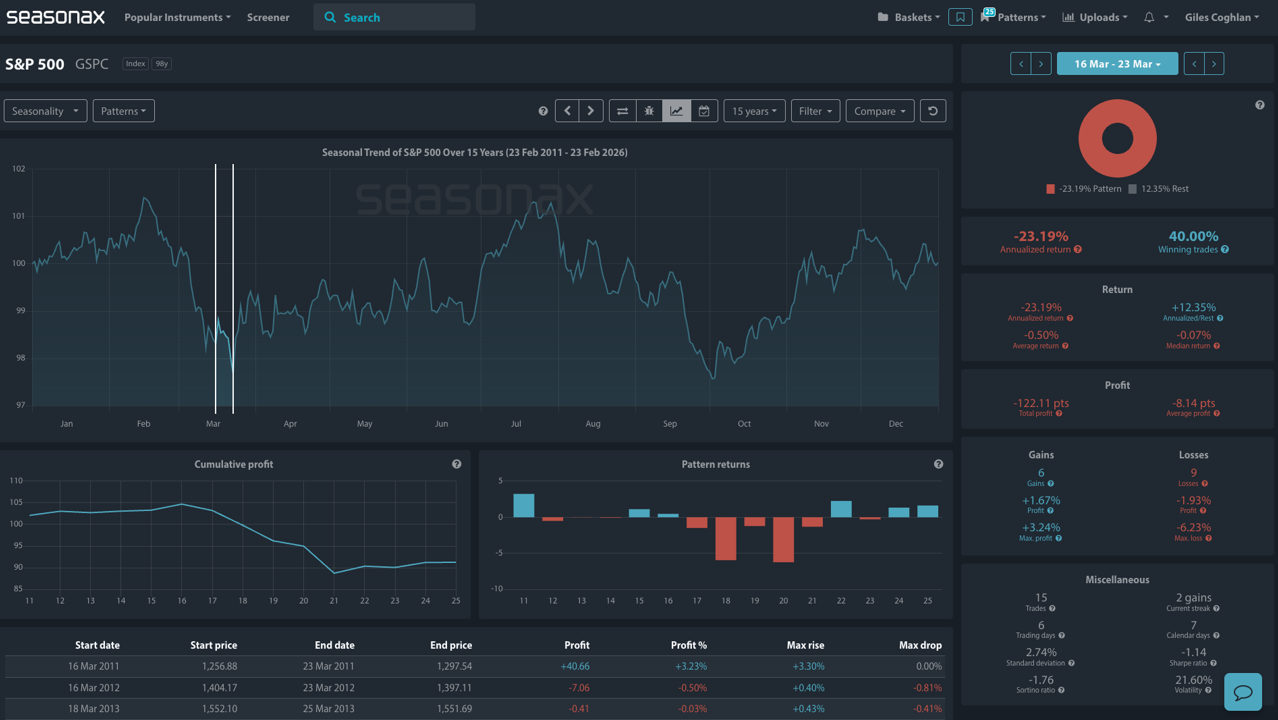
In fact, the pattern return distribution shows several negative outliers, including sharp downside moves around the 20th trading day of the month – a reminder that volatility can expand quickly even in otherwise constructive years. The period between March 16 and March 23 over the last 15 years is highlighted in the chart below. There has been an average fall of 0.50%.
March, historically, is less about trend extension and more about consolidation.
The Bigger Picture: Q2 Seasonality Turns Positive
Importantly, this March softness sits within a much stronger seasonal backdrop immediately ahead.
The chart below shows that the dynamic changes from 1 April to 30 June where, over the last 15 years, the S&P 500 has delivered the following:
- Average return: +3.26%
- Annualized return: +13.87%
- Winning percentage: 80%
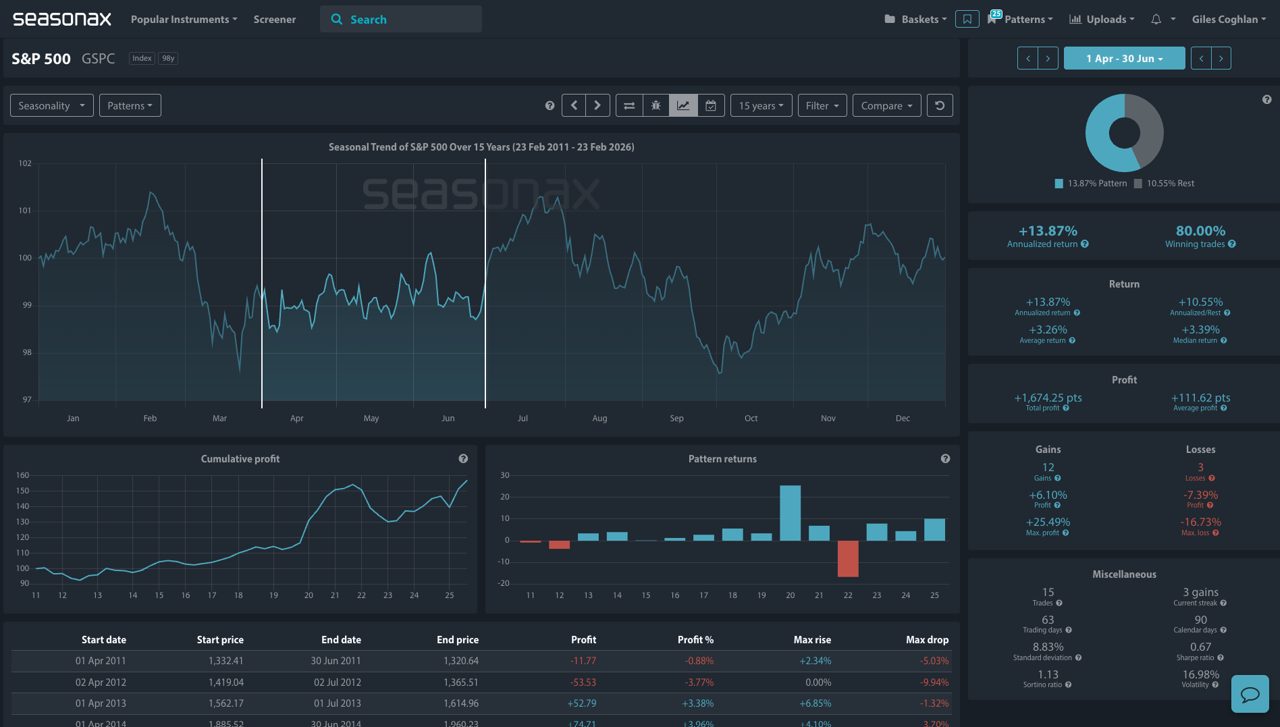
In contrast, the cumulative Q2 profit curve rises steadily for Q2, reflecting a consistent seasonal tailwind into late spring.
In short:
- March = hesitation
- Q2 = re-acceleration This transition from consolidation into expansion is one of the cleaner seasonal rotations in US equities.
Why This Pattern Makes Sense Structurally
Several macro factors reinforce the seasonal setup:
- Earnings season strength – April kicks off Q1 earnings, which historically provides directional catalysts.
- Institutional reallocation – Pension and asset managers rebalance at quarter-end, often deploying capital early in Q2.
- Post-tax season liquidity normalisation – US tax deadlines mid-April can temporarily suppress flows in March before releasing liquidity into Q2.
These factors can help explain why March often feels volatile and directionless, while April tends to regain momentum.
Tactical Takeaway
March should not necessarily be viewed as bearish, but seasonality shows it has historically been less reliable for upside extension compared with Q2.
Traders may consider the potential for the following:
- Expecting volatility spikes rather than smooth continuation
- Being patient for better Q2 entry setups
- Watching mid-to-late March for exhaustion patterns
If history is any guide, early-year strength does not typically accelerate in March, it pauses. However, once April begins, the seasonal odds shift decisively back in favor of the bulls.
Use Seasonax for your professional handling of market-moving events.
Don’t just trade it. Seasonax it.
Giles Coghlan, CMT
Macro Strategist Seasonax