Dear Investor,
Again and again I am asked whether the so-called cryptocurrencies also show seasonal patterns.
You may be asking yourself the same question. Clearly, whether you invest in cryptos or not, the consideration of seasonality in a new asset class is exciting.
It is time to take a look at Bitcoin’s seasonal performance!
Bitcoin has a pronounced summer weakness
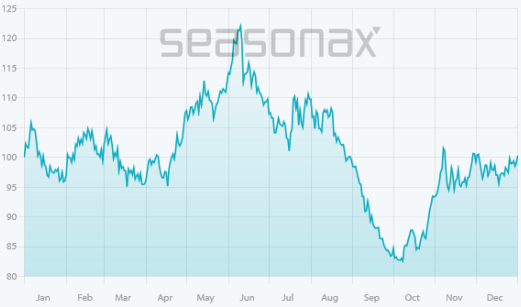
The chart below shows you the course of the price of bitcoin depending on the season. The horizontal axis shows the time of the year, the vertical one the value of the seasonal index.
Bitcoin, seasonal trend, determined over 13 years
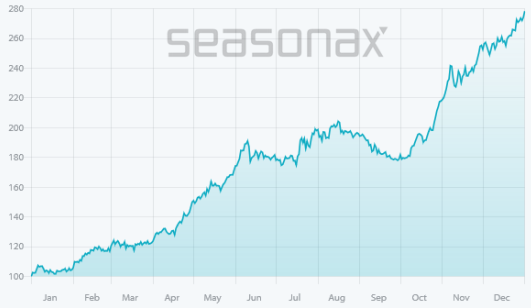
From June 10, the seasonal trend is slightly downward. Source: Seasonax
As you can see, there is a “summer hole” in the price performance of bitcoin: value fell seasonally in the period from June 10 to October 2.
The optimal seasonal timing in Bitcoin
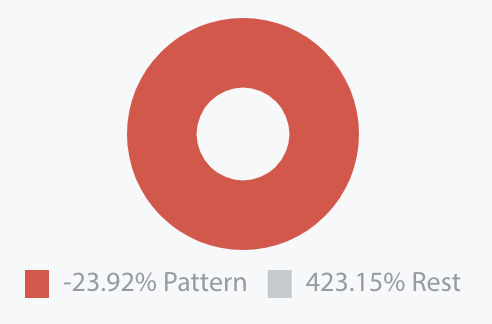
The average price loss between June 10 and October 2 was 8.18%. This corresponds to an annualized loss of 23.92%.
The weakness of the phase becomes clearer if we compare it with the seasonally good phase. Conversely, bitcoin rose by an average of 212.13% between October 2 and June 10. This corresponds to an annualized gain of 423.15%!
Annualized returns help you evaluate seasonal phases
With a value like Bitcoin, which has formerly risen strongly, seasonal periods of weakness are naturally not very pronounced in the past, as the value of 8.18% demonstrates.
However, the extent of the seasonal trend becomes clear by comparing it with the rest of the time. This is best done numerically using the annualized return. As mentioned, it was 23.92% during the weak phase and 423.15% during the rest of the period. This very high difference shows the relative weakness of the weak phase in the period from June 10 to October 2.
By comparing the annualized returns of the marked phase with the rest of the time, you can basically evaluate the extent of a seasonal trend numerically. In the Seasonax app you can find both values in the upper right corner under the circle, and thus gain a visual understanding of the facts:
Detrending helps you to recognize seasonal weak phases
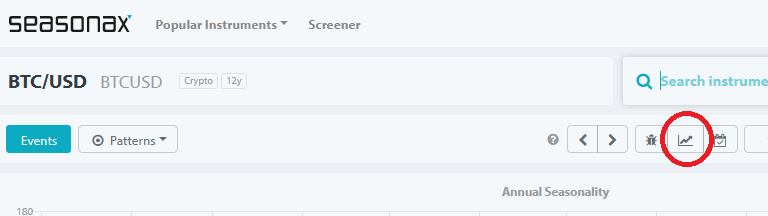
However, there is also a purely visual method of highlighting seasonal trends: detrending. You can easily turn it on in Seasonax by clicking on the button with the arrow symbol above the chart:
Detrending switch in Seasonax
Detrending makes the seasonal trend more visible. Source: Seasonax
Detrending removes the overriding trend. The end point of the chart is at the start point. For this purpose, the superordinate price movement is mathematically deducted proportionally distributed over all days.
In the detrended chart you can visually recognize the seasonal trend faster. It is “amplified”, so to speak. This makes it easier for you, for example, to recognize weak phases in instruments that have risen strongly in the past, such as bitcoin.
The next chart shows you the detrended seasonal trend of Bitcoin:
Bitcoin, detrending seasonal trend, determined over 13 years
The seasonal periods of weakness areclearly visible. Source: Seasonax
Now you can see the seasonal weakness phase in Bitcoin from June 10 to October 2 much more clearly. It means that without the strong underlying trend of the past years, Bitcoin shows a pronounced seasonal weakness here.
Thus, in the coming months, Bitcoin is due for a seasonal period of weakness.
However, there are other tools where detrending can help you see the seasonal progression. You can try detrending in Seasonax for yourself now!
Warm regards,
Dimitri Speck
Co-Founder and Chief Analyst of Seasonax
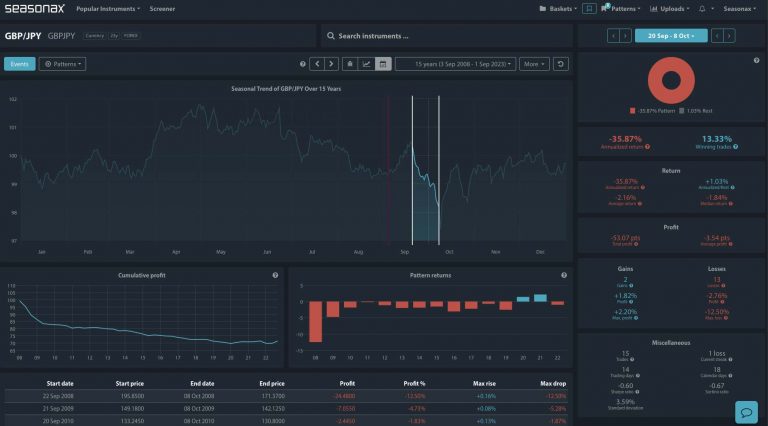
PS: Bitcoin also shows a seasonal pattern.