Dear Investor,
What do you, as an investor, think about when looking ahead to 2026? Perhaps you pay attention to technical or fundamental factors that can influence share prices.
However, there is also a significant multi-year cycle: the 4-year cycle. It lasts four years and influences prices on the US stock market.
It’s also called the election cycle. The year of the four-year election cycle we’re in is important for the stock markets. The upcoming year, 2026, is a so-called midterm election year. How will it perform in the four-year cycle?
The 4-year cycle influences the markets
The phenomenon known as the four-year or election cycle does not differentiate by party, but rather by the year of the presidency. In the 125 years between 1900 and 2024, the Dow Jones rose by an average of 5.70% in presidential election years. It performed even better in the primary election years, rising by 8.95%. In contrast, the average increase was only 4.75% in the post-election years and a mere 0.78% in the subsequent midterm election years.
The midterm election year is therefore the worst year in the four-year cycle. This is not a good outlook for stock prices in the coming year, which is a midterm election year.
The 4-year election cycle in detail
But what does the development look like in detail? Take a look at the average four-year performance of the Dow Jones in the chart. The scale on the right shows the percentage gain. The scale below shows the year within the four-year cycle.
Above “Election” is the average trend for all election years; above “Post-Elect.”, for all post-election years; above “Midterm,” for all midterm election years; and above “Pre-Election,” for all pre-election years. The chart allows you to examine developments within the cycle in detail.
Dow Jones, 4-year cycle, over 126 years
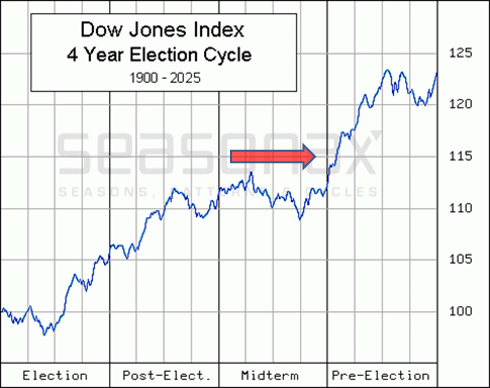
As you can see from the final value of the scale, the average increase over the entire four-year period was 23%.
While the other three years of the cycle were more or less positive, the midterm election year, marked with a red arrow, brought investors hardly any profits on average.
The year 2026 is approaching, and it threatens to be a relatively bad year for the stock market.
The reasons for the presidential election cycle appear to be fiscal and monetary policy in nature and are likely related to the elections.
A closer look at the midterm election year
The next chart shows you the average trend only for midterm election years, such as 2026. This chart is essentially an enlarged version of the third quarter of the first chart.
Average performance of the Dow Jones in a midterm election year
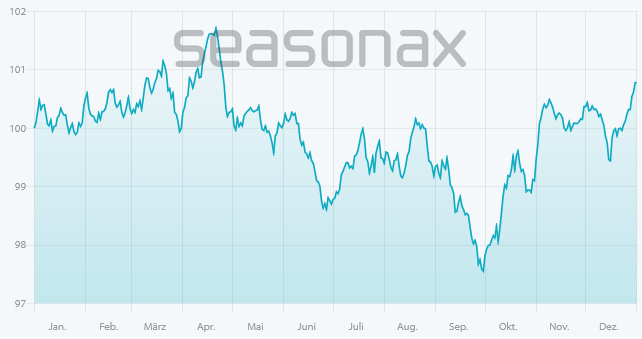
You can clearly see the slowdown starting in mid-April – a kind of slightly premature “sell in May and go away” effect. However, the rise also occurs earlier, namely at the end of September. Overall, this midterm election year is problematic.
There are good chances even in a midterm election year!
The only problematic aspect is the overall market. Many individual stocks and sectors deviate from the index’s performance and offer good opportunities even in challenging times. Furthermore, there are short selling opportunities and other markets, such as precious metals. Take advantage of the diverse opportunities the markets offer!
Warm regards,
Dimitri Speck
Founder and Chief Analyst of Seasonax
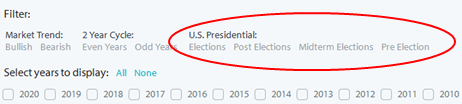
PS / How to use the filter function on Seasonax:
If you would like to examine the four-year cycle yourself, simply access the filter function on Seasonax in the top right corner of the chart under “More”: