Dear Investor,
Eight times a year the world is holding its breath waiting for the announcements of the Federal Open Market Committee (FOMC).
The Fed has a dual mandate: to maximize employment and to keep prices stable. It does that by setting the target for the most important interest rate that affects the entire US economy including the US stock market – the Federal Funds Rate (the rate at which banks lend to each other overnight).
This rate is tightly linked to inflation. Countless inflation headlines have drawn our attention in recent months. But how does inflation actually work? To keep it simple: when interest rates are kept low, borrowing appears more attractive to households and corporations, which will stimulate additional growth.
Consumers will spend more and businesses will be able to finance their operations and pay for expansions. As a result, their future prospects improve, making their stocks more attractive. Greater availability of credit leads to more buying/spending and with a lag to surging inflation. This in turn gives rise to rate hikes, leading to a reversal of the process described above.
Stock Market Reaction to Rate Hikes
The last hike in the Federal Funds Rate hike was implemented on December 20, 2018. Back then, the world looked different, GDP growth was 2.07%, the unemployment rate stood at 4.7%, CPI inflation was 2.05% and the Federal Funds Rate was set at a range of 2.25 – 2.5%.
The Fed made its famous promise not to take any further steps regarding rate hikes. And they have kept it until today! (Since then, some traders jokingly refer to Fed chair Jerome Powell as J. “Pivot” Powell).
On March 15 2020, the Federal Funds Rate was cut to a range of 0% to 0.25% and has been held there ever since. During the pandemic cutting rates appeared to be a sensible measure, but what will happen when the global economy completely reopens again, and inflation fears persist?
By looking at the past performance of the S&P 500 Index we can draw some conclusions and prepare for the future.
The chart below shows the average performance of the S&P 500 Index over the 62 trading days before and after rate hikes by the Fed. The chart was calculated over the past 30 years, during which 40 rate hikes have been implemented. The horizontal scale shows the number of days before and after the Fed announced a rate hike, the vertical scale the average move of the index in percentage points. The vertical orange line marks the day of the rate hike.
Performance of the S&P 500 Index 62 days before and after a rate hike in the past 30 years
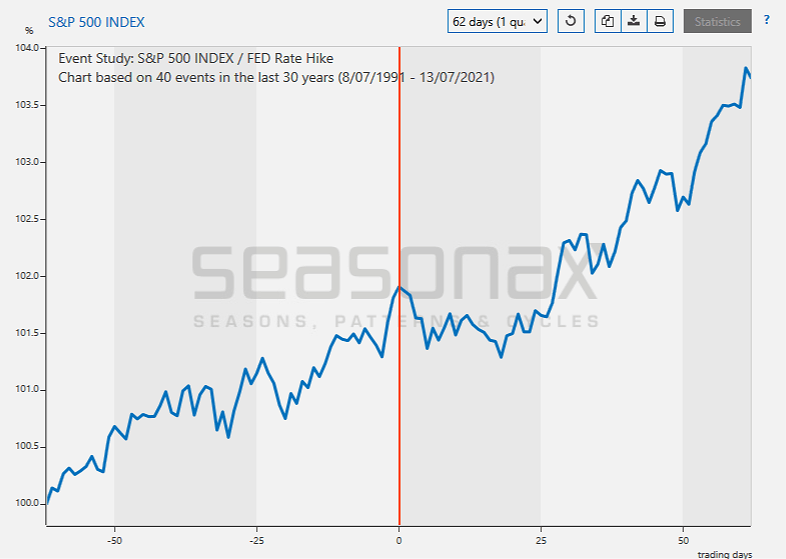
Source: Seasonax
On the seasonal chart it can be clearly seen that the S&P500 Index enters a downtrend immediately after the rate hike announcement.
However, not very long after the rate hike, prices begin to increase again. To be precise, 18 days after the rate hike the index begins to generate positive returns – in exactly 77.5% of the past 40 events in the period under review. Statistically speaking the S&P500 Index posts a strong average gain of 2.51% between the 18th and the 61st day following a rate hike.
Pattern returns of the S&P 500 Index for every year since 1994 in which a rate hike was implemented
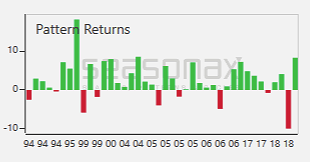
Source: Seasonax
Fast forward
The annualized US inflation rate accelerated to 5% in May 2021. This represents the highest reading since August 2008. According to Trading Economics the biggest price increases were recorded in gasoline (56.2%), used cars and trucks (29.7%), utility gas service (13.5%), transportation services (11.2%), apparel (5.6%) and food (2.2%).
How the Fed will deal with the rising prices and inflation in the future remains an open question for the time being. However, one thing is certain: the market will definitely react.
Addendum: it should be noted that seasonality measured from 1994 (as in our example) refers to a disinflationary era, this is to say, inflation was in an overarching secular downtrend during this time. As long as that remains the case, seasonality charts (indirectly) related to inflation and referring to this time period will remain valid. However, if the secular inflation trend reverses as it did in the 60s and 70s, this may well change. Experience shows inter alia that stock market valuations will contract significantly (P/E ratios will plummet).
Apart from events such as the Fed meeting, seasonality analysis shows that there exist countless recurring patterns in all kinds of different markets. From stocks to indexes, commodities, currencies and even bonds, every market has something to offer.
To make finding these opportunities even easier, we have launched a Seasonality Screener. The screener is an analytical tool designed to identify trading opportunities with above-average profit potential starting from a specific date. The algorithms behind the screener are based on predictable seasonal patterns that recur almost every calendar year. Feel free to analyze more than 20.000+ instruments including stocks, (crypto)currencies, commodities, indexes by signing up for a free trial.
Yours sincerely,
Tea Muratovic
Co-Founder and Managing Partner of Seasonax