- Instrument: The Home Depot, Inc. (HD)
- Average Pattern Move: +1.30%
- Timeframe: 23 May – 2 June
- Winning Percentage: 86.67%
Dear Investor,
You may not realise it, but Home Depot has a habit of rallying into the final week of May—and this year, it may have technical backing too. With earnings due on Tuesday, May 20 before the open and news circulating of a potential U.S.–China tariff de-escalation, seasonal and technical forces are aligning. We want to analyse the data in more detail.
Seasonal Snapshot: Late May Strength
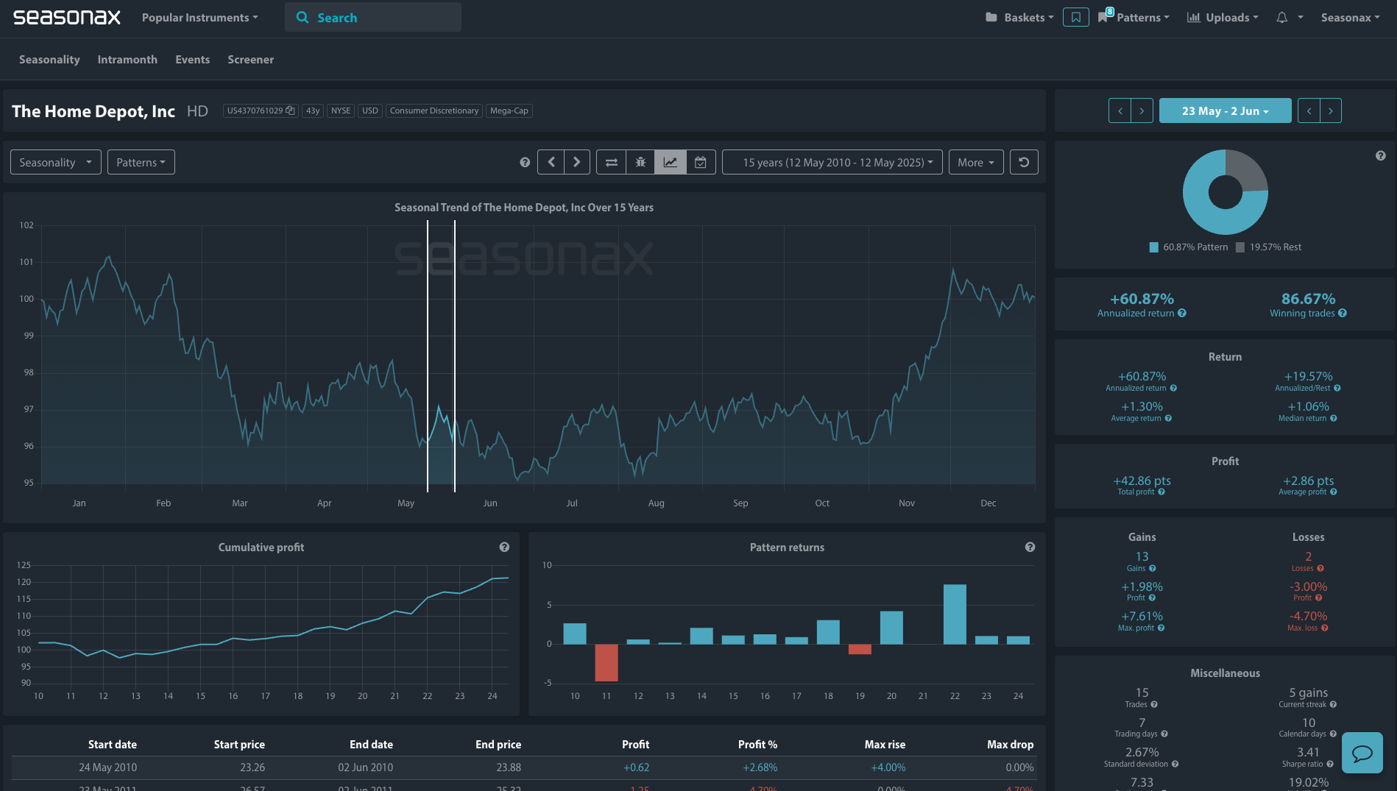
The chart above shows you the typical development of Home Depot’s share price from May 23 to June 2 over the past 15 years. With a winning percentage of 86.67%, this period has historically been a strong one for the stock, delivering an average return of +1.30%.
This performance often coincides with peak home improvement demand, but this year the narrative is broader: an improving macro backdrop and firming technical support are raising the odds of another strong seasonal stretch.
Fundamental Catalyst: Trade Peace on the Horizon?
Reports suggest U.S.–China tariffs could be dialled back as diplomatic efforts continue, lifting some of the pressure on consumer discretionary firms like Home Depot that are sensitive to supply chain costs. For a company already facing slowing housing turnover, such relief would be timely and could lift sentiment following earnings.
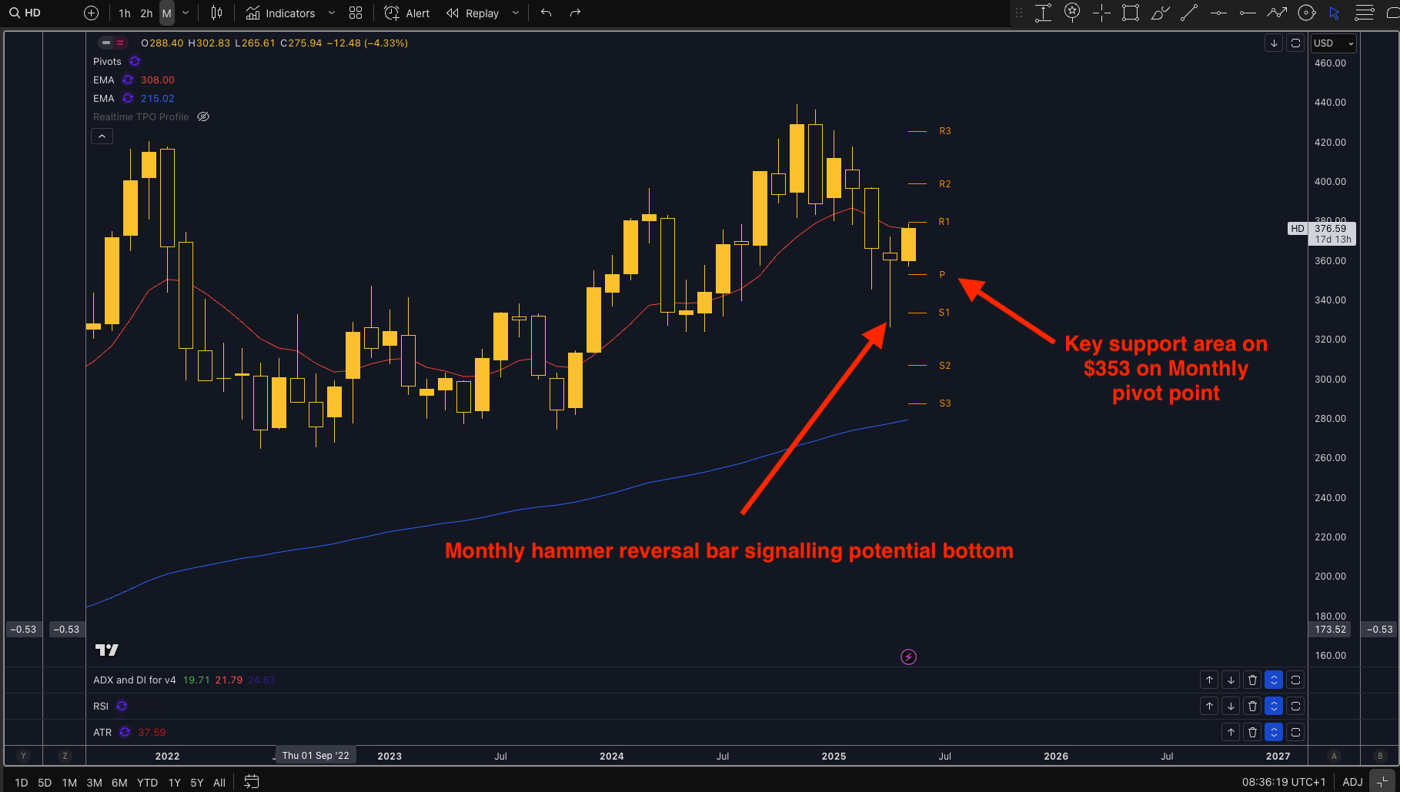
Technical Picture: A Bottoming Setup?
The monthly chart below offers bullish clues: a monthly hammer reversal bar has formed, often signalling a near term potential bottom. Crucially, the stock has found footing near $353, which also marks the monthly pivot point—a key support zone. If this level holds post-earnings, the setup could act as a launchpad for a seasonal bounce higher into early June.
Trade Risks
The moves in Home Depot will very much depend on the earnings detail and any updates regarding tariff policy. A disappointing earnings print or renewed trade tension could overpower otherwise strong seasonal support, so this remains a high-risk setup.
With Seasonax, identify patterns like these and more, backed by data and built for strategic investors.
Sign up here for more of Seasonax!