Dear Investor,
Do you know the most common question I am asked about seasonality?
It is: “Mr. Speck, how many years should I choose for calculating the seasonal trend in the chart so that a seasonal pattern is particularly promising and reliable?”
My answer is: “10 years is sufficient.”
The best number of years in practice
Of course, statistically speaking, it would be more significant to take 20 years instead of 10, for example. Nevertheless, 10 years is sufficient in most cases.
You may be surprised by my answer at first glance. Statistically speaking, it is indeed better if a stock rose in 18 out of 20 cases during the autumn rally than in 9 out of 10. Although the hit rate of 90% is the same in both cases, it is supported by a larger number of values.
That’s why I used to take the largest possible number in most cases.
However, I have since carried out extensive retrospective calculations using past prices and seasonal trends to check what really worked.
These retrospective calculations showed that even with a calculation basis of 10 years, seasonal patterns can achieve a good outperformance.
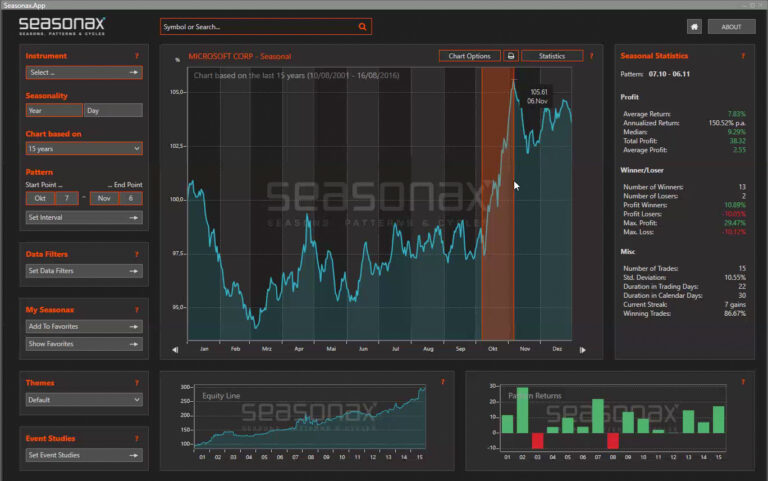
Therefore, first look at seasonality over 10 years. This is also the default setting in Seasonax. After that, I sometimes select a larger number of years. This is very easy to do in Seasonax in the settings above the chart.
However, a larger number only gives me more certainty and is not the decisive basis for my decisions.

Why 10 years is usually sufficient
Timeliness is the main reason why 10 years is usually sufficient. After all, what does it mean today if a stock did not perform significantly better than the S&P 500 Index during a certain seasonal phase 10 or 20 years ago? Possibly nothing, because the reasons for seasonal patterns can change over time.
Like everything else in the markets, seasonal trends are not completely rigid, but rather dynamic.
That’s why, in most cases, it is sufficient for me if an instrument has displayed a strong seasonal pattern over the past 10 years. What matters far more than the sheer number of years is how evenly the returns are distributed within that period. I am happy to accept one or two outliers:
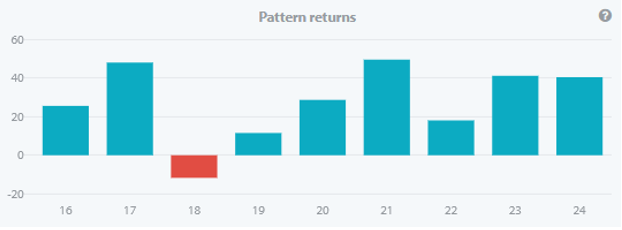
Incidentally, the most recent year can be negative — it may well have failed to generate a profit during the relevant seasonal window. My retrospective calculations have confirmed this time and again.
I make my preliminary selection using the screener
But how do I actually choose my stocks? I usually use the screener for this. The default setting for this is also 10 years.
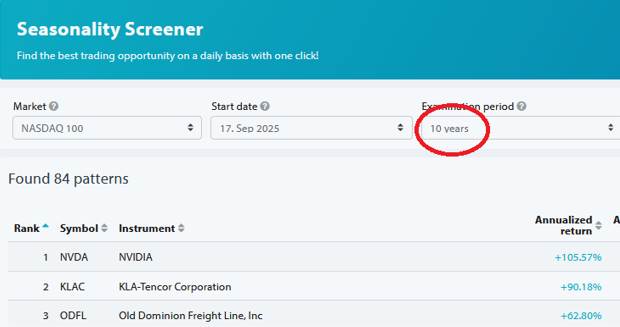
You can also change this default setting if you like.
However, if you select 20 years instead of 10 for the NASDAQ 100, the number of stocks included drops from 84 to 66. And if you then adjust other parameters, such as the hit rate, the pool of stocks can shrink even further, sometimes becoming quite small.
This highlights another advantage of using 10 years: the screener displays more instruments, since not all stocks have a 20-year trading history. That’s why I rely on the default 10 year setting in the screener when searching for instruments with strong seasonal patterns..
Find good seasonal patterns for yourself!
I hope you have gained a better insight into the practice of seasonal trading.
With Seasonax, you can easily find good seasonal patterns to improve your trading.
I wish you every success – and lots of fun!
Best Regards,
Dimitri Speck
Founder and Chief Analyst at Seasonax
PS: Practical tips will help you improve your returns!