Dear Investor,
Prices are rising and rising, and many analysts fear that interest-sensitive sectors, such as technology stocks, could come under pressure.
At Seasonax, therefore, we also look at the seasonality of commodities and commodity stocks – such as copper. In this way, we want to help you increase the probability of profit for your investments and minimize their risks.
Since many commodities, and commodity stocks, have been moving rapidly upwards for some time, I would like to take a seasonal look at copper for you today.
The Seasonal Trend of Copper
Let us consider the seasonal chart of copper. In contrast to common charts, the seasonal chart shows you the average development of the copper price in US dollars depending on the season. For this purpose, the average price return from a total of 25 years is calculated.
On the horizontal axis you can see the time of the year, on the vertical axis the seasonal chart shows the price information. Thus, with the help of the seasonal chart, you get an impression of the typical seasonal trend of the copper price at a glance.
Copper’s seasonal trend over 25 years
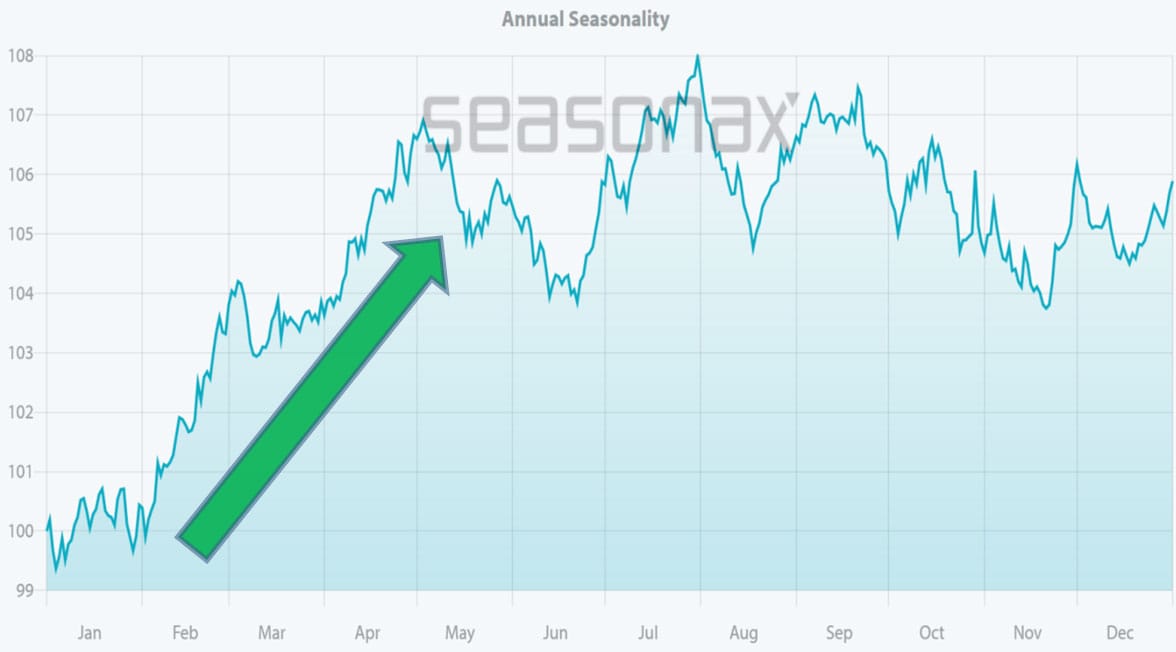
The seasonal increase begins at the end of January. Source: Seasonax
As you can see, the end of January is a good seasonal entry point. The seasonal uptrend lasts until the beginning of May.
The phase marked by the arrow begins on January 29 and lasts until May 3.
This is the best seasonal phase for copper.
The average return over the past 25 years has been 7.3%, which is higher than the average price gain over the entire year!
High Profits in Particular Years
But how does it look seasonally for the individual years during this phase? For this purpose, the bar chart shows you the yield of copper in the period between January 29 and May 3 for the past 25 years. In blue you can see the years in which there were gains, in red those in which there were losses.
Copper, yield in percent between January 29 and May 3, for individual years since 1997
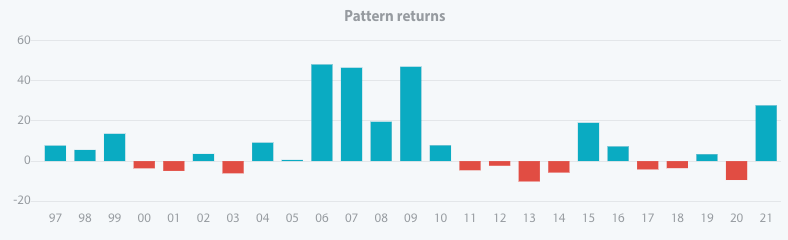
Individual years can be sharply down. Source: Seasonax
As you can see, some bars are pointing strongly upwards. Keep in mind: copper was in a bear market for many years, so that even seasonally good phases appear red here. But you can also see from the high bars that in individual years there was a sharp upward trend with gains of over 40%. In bull markets there was a lot of money to be made with copper!
Take Advantage of the Selection!
The coming years could offer you many opportunities in the commodities sector. But it’s not just about commodities. Commodity stocks also have seasonal phases. Try it out right now on Seasonax! The screener will help you with your search. This way you can also diversify with the help of stocks that benefit from inflation.
Best regards,
Dimitri Speck
Founder and Head Analyst of Seasonax
PS: Do not fear inflation, use the most profitable sector!