Dear Investor,
Eight times a year, the Federal Open Market Committee (FOMC) of the U.S. Federal Reserve (FED) meets to discuss and decide on monetary policy, and the level of key interest rates.
In view of the dramatic rise of the inflation rate to 7.5% at last count, it is generally expected that increases in the key interest rates by 0.25%, or even 0.5%, will be decided at forthcoming FOMC meetings. The next FED meeting is in a week’s time, on March 15-16.
You’re probably wondering: how do interest rate hikes affect stock prices? I would like to show you this in detail.
An overview of FED meeting dates
The next FOMC meetings therefore are of particular importance. Below is a list of the 2022 FOMC meeting dates for your records.
FED Meeting Dates 2022:
FOMC meeting March: 15-16
FOMC meeting May: 3-4
FOMC meeting June: 14-15
FOMC meeting July: 26-27
FOMC meeting September: 20-21
FOMC meeting November: 1-2
FOMC meeting December: 13-14
FOMC meeting dates for 2023 are expected to be published in June 2022.
Key rate hikes at FOCM meetings affect stock prices!
But how do the FED’s FOMC meetings affect the markets when it comes to rate hikes?
To answer this question, we can examine the impact on the S&P 500 by looking at the typical course of stock prices before, and after, the second day of the FED meeting. This is the day on which the decision is announced.
The following chart shows you the average course of the S&P 500 in the 62 trading days (corresponding to one quarter) before, and after, the second day of the FOMC meeting; although this results in overlaps, you can also see the medium-term picture.
This chart was calculated for the past 30 years, during which there have been 40 interest rate hikes. The horizontal scale shows the number of days before, and after, the second day of the relevant FOMC meeting; while the vertical scale shows the average trend in percent. The orange line marks the day of the rate hike.
In this way you can see at a glance, in the event chart, what the typical course of US share prices looks like around key interest rate increases.
Mean trend of the S&P 500 trading 62 days before and after key interest rate hikes at FED meetings (1992 until 2021)
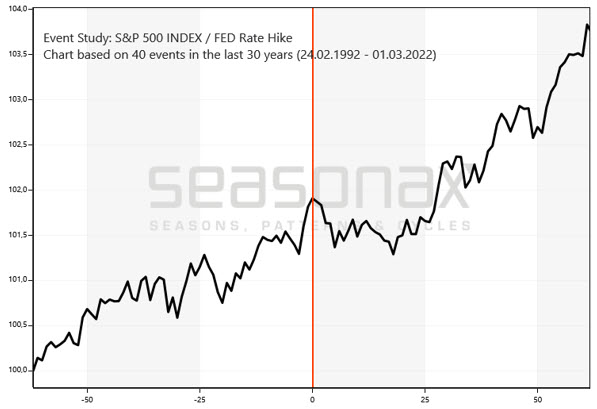
As you can see, stock prices rise three days in advance of the rate hike announcement (by 0.61% on average).
Then they hardly move for two days.
Only in the following three days do they react to the interest rate hikes, with a relatively slight decline. Then they run sideways.
However, already 18 trading days after the key interest rate hike, prices are rising again!
The rise is even somewhat steeper on average, so that prices can catch up and the FED’s interest rate hikes do not dimin-ish the overall trend.
FED meetings do not break trend!
As you can see, the stock markets are reacting to the rate hikes that will be decided at the FED meetings.
But this is rather short-term. There is a rise a few days before, then a fall, and a sideways trend for a few weeks.
This does not break the overriding trend.
So it’s still worth looking for good investment opportunities in the stock market with Seasonax.
Do you have any wishes or comments? Then simply let our customer service know using the feedback form in the Seasonax app!
Best regards,
Dimitri Speck
Founder and Head Analyst of Seasonax
PS: Take systematically advantage of seasonality in individual stocks