Dear Investor,
Currently, implied volatility, as calculated from option prices on the US stock market, is relatively low. The Bank of America recently found that there has not been a cheaper time to hedge over a twelve-month period since 2008.
This raises these questions for you as an investor: has a phase of permanently low volatility now been reached? Or is the current low volatility merely the calm before the storm?
With such questions about the future development of the stock market, it is usually worth taking a look at stock market history.
For this analysis, I use one of the longest available time series, that of the Dow Jones Industrial Average starting in 1915. That’s over 100 years of stock market history. For better comparability, I remove the Saturdays on which trading took place in previous years.
I then smooth out the data by calculating the historical volatility, rolling and overlapping over the past 21 trading days (about a calendar month).
The volatility over the year
But is an increase in volatility to be expected now? Let’s take a look at the seasonal cycle.
The next chart shows you the seasonal course of the 21-day volatility of the Dow Jones over the entire investigation period from 1915. I’m showing the volatility in the middle of the 21-day period so that the smoothing does not lead to a time shift. The horizontal axis represents the point in time of the year, the vertical axis shows the mean volatility level.
This allows you to see at a glance how volatility is typically seasonal.
Dow Jones Volatility, Seasonal Pattern, 1915 to 2023
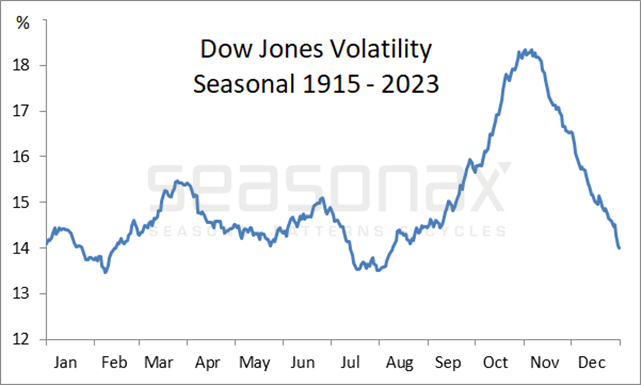
The fluctuations increase until November. Source: Seasonax
As you can see, despite the very long survey period with a large number of measurement points, there is a pronounced seasonality in volatility.
At the end of July to the beginning of August, there was a veritable summer lull with average values of less than 14%.
Then there is an increase that ends in early November at 18.3%.
Fluctuations increase seasonally!
Currently, many investors pay little attention to volatility. They seem to feel safe.
However, this might not be such a good idea given the typical seasonal pattern, with spikes in volatility well into November.
The seasonal course is still hardly used by traders in the volatility and options markets. On the other hand, you can be ahead of your competitors and take advantage of seasonality across all your instruments.
Go to www.seasonax.com! There you will find precise seasonal charts, event studies and much more.
Kind regards,
Dimitri Speck
Founder and Head Analyst of Seasonax
PS: Is it currently the calm before the storm?