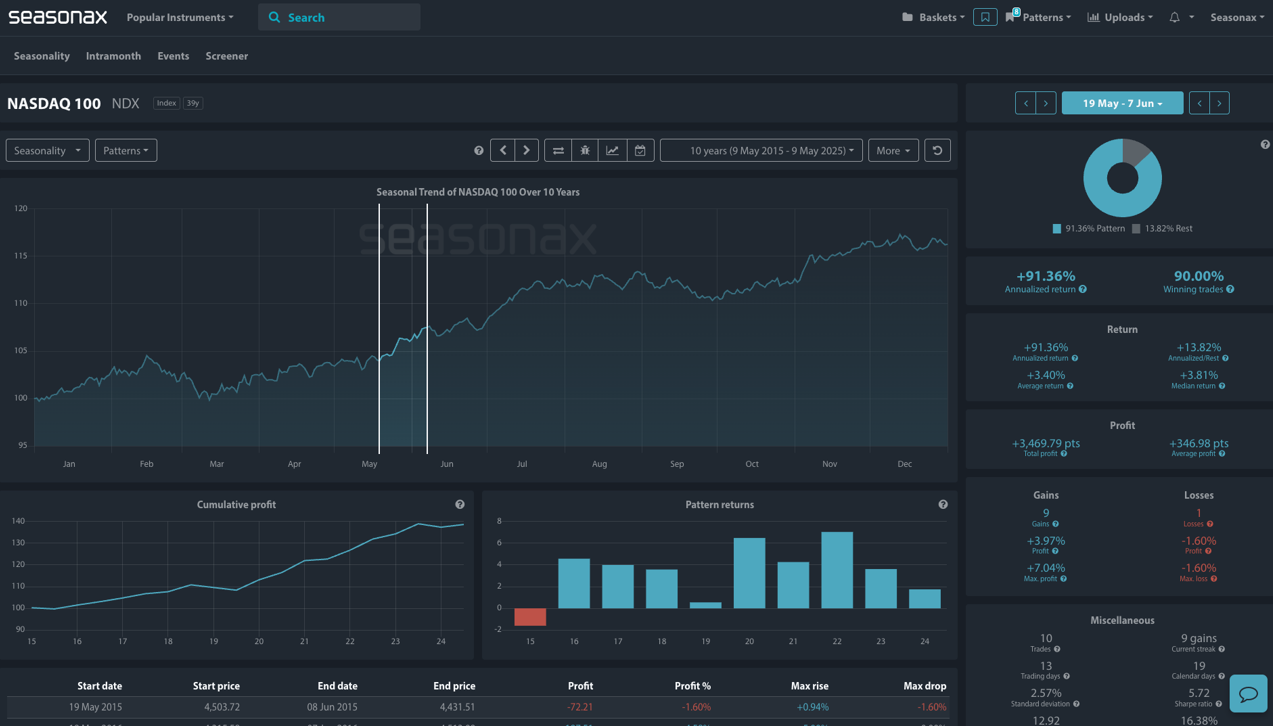
- Instrument: NASDAQ 100 (NDX)
- Average Pattern Move: +3.40%
- Timeframe: 19 May – 7 June
- Winning Percentage: 90.00%
Dear Investor,
You may not realize it, but the Nasdaq 100 Index has a distinct seasonal pattern that has favored the final two weeks of May over the last decade. With the AI-driven tech narrative still dominating headlines, this time of year tends to generate a surprisingly strong statistical tailwind for the index. Today, we want to analyze the data in more detail.
A May Pattern Many Miss
The chart shows you the typical development of the NASDAQ 100 from May 19 through June 7 over the past 10 years. The seasonal return is particularly strong, with an average gain of +3.40% and a striking 90% win rate. Cumulative profits have consistently risen over this period, reflecting broad tech optimism heading into the summer.
This may surprise some investors who associate May with the old market adage “Sell in May and go away.” But for the Nasdaq, this part of the calendar tends to be an exception to that rule over the last 10 years.
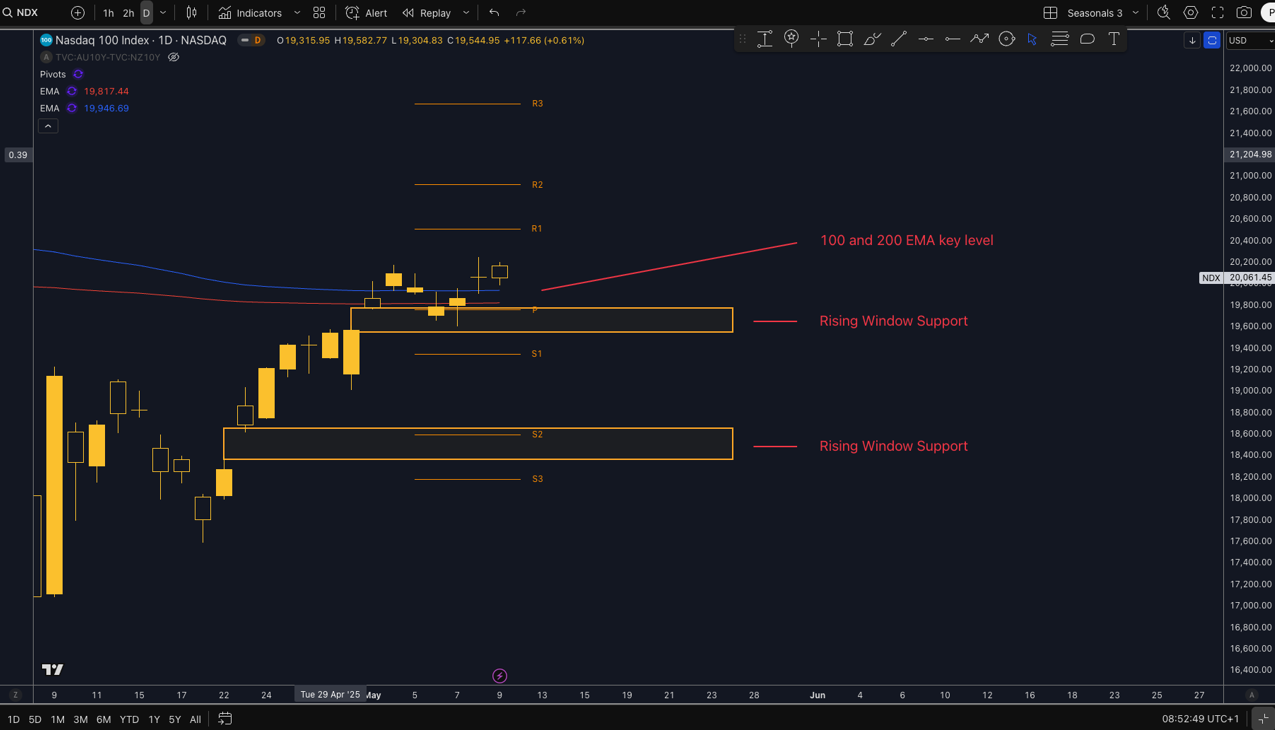
Technical Perspective
Recent price action supports the bullish outlook. The daily chart shows the Nasdaq bouncing off a key rising window support zone—a classic bullish continuation structure—while remaining comfortably above both the 100-day and 200-day exponential moving averages. These moving averages are converging just below current prices, offering further reinforcement to the bullish case.
If the index holds above the ~19,600–19,800 support zone, we may see momentum accelerate toward new highs.
Macro Context: AI Strength and Rate Optimism
Macro conditions continue to support tech. Easing inflation concerns and expectations that the Fed will avoid further tightening have been a key tailwind. With Nvidia earnings later in May and sustained flows into big tech names, the seasonal momentum could line up neatly with macro drivers.
Trade Risks
The seasonal trend relies heavily on strong sentiment and a supportive macro backdrop. Any major tech earnings disappointments, renewed inflation shocks, or a broad market correction could derail the expected pattern.
Explore similar setups across indices, tech stocks, and ETFs with Seasonax’s award-winning seasonal analytics.
Don’t just trade it, seasonax it