- Instrument: Nomura Holdings
- Average Pattern Move: -8.10%
- Timeframe: May 4 – September 25
- Winning Percentage: 28.00%
Dear Investor,
You may not realize that while Nomura ramps up its US presence — including recent expansions into high-grade credit and investment banking coverage — the stock has historically suffered through the summer months. Nomura Holdings Inc. agreed to purchase Macquarie Group Ltd.’s US and European public asset management business for $1.8 billion. This year, as Japanese banks struggle with weak domestic loan demand and tighter US credit spreads, Nomura’s exposure may make its seasonal vulnerability even more relevant.
With the strategic pivot toward US capital markets in full swing, we want to analyse the data in more detail.
A Seasonal Slog from May to September
The chart below shows you the typical development of Nomura Holdings’ share price over the 25-year period between 2000 and 2024. During the highlighted seasonal window — from May 4 to September 25 — the stock has posted an average return of -8.10%, with a success rate of just 28.00%.
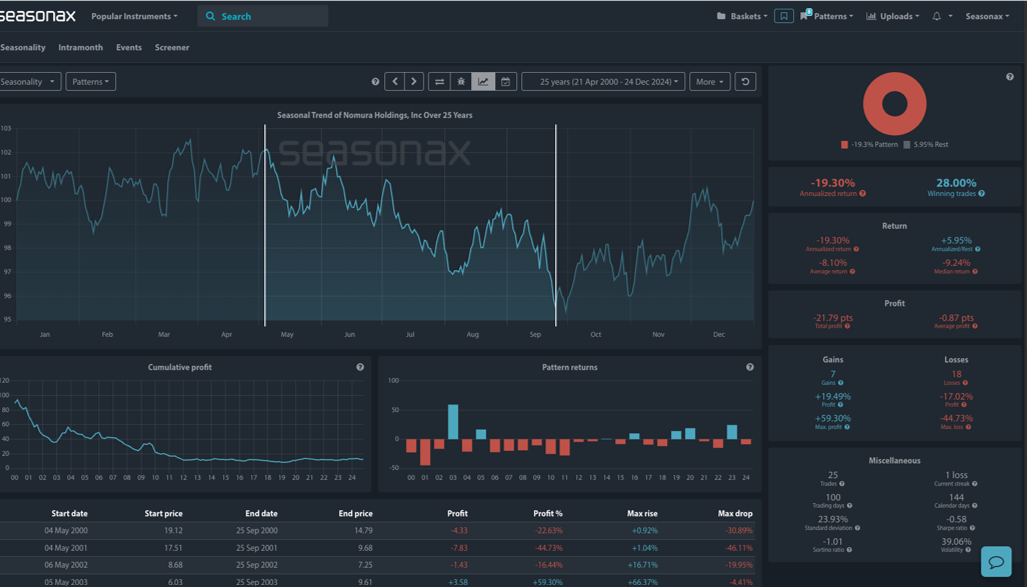
Out of 25 years, 18 trades were negative, and many saw double-digit drawdowns, especially during periods of US financial stress or global deleveraging phases.
This period covers not only the “sell in May” effect but also low liquidity in the summer and the risk-off positioning typical around Japanese fiscal revisions and global earnings adjustments.
Nomura’s U.S. Push: A Tough Ask in a Tough Season
Nomura is not standing still. The firm has been expanding in the US, with major hires across fixed income, US credit and equity derivatives. Its acquisition of Macquarie Group Ltd.’s US and European public asset management business signal an ambition to be more than just an Asia-based investment bank.
But this pivot comes with risk. The US market is currently grappling with recession fears, sticky inflation, and a volatile rate outlook. Meanwhile, Nomura’s Japan-heavy balance sheet may not be ideally suited to navigate the Fed’s high-for-longer stance. Investors may start asking whether the cost of Nomura’s US expansion will translate into sufficient returns. And if not, that could be a trigger for seasonal underperformance to reassert itself.
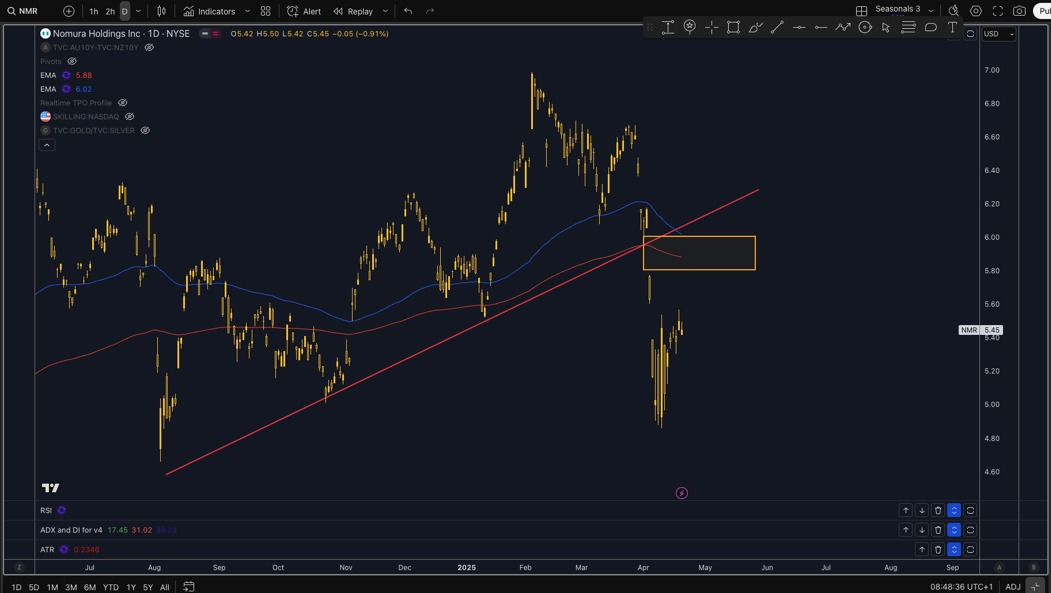
Technical Perspective
From a technical standpoint there is a major trend line resistance point on the daily chart marked below around the 6 region. This area also combines with a large falling window, the 200EMA, and the daily trend line from October last year.
Use Seasonax for your professional handling of market-moving events!
Sign up here for thousands more seasonal insights waiting to be revealed!
Trade Risks
If Nomura’s earnings surprise to the upside due to deal flow in the US or stronger performance in yen-linked trading desks, seasonal weakness may be muted. Additionally, easing US financial conditions or a pivot by the Fed could support Nomura’s US ambitions in the second half of this year.
Don’t Just Trade It – Seasonax It!