Dear Investor,
Problems surrounding Evergrande, the Chinese property development company, are causing unrest in the stock markets. On top of this, October has also begun – the month that has a particularly bad reputation for traders!
Is that bad reputation justified?
October – the most dangerous month?
The table below shows you the 20 strongest daily declines in the Dow Jones. Now, take a closer look at the extreme movements I have marked in red. These are the cases that occurred in the month of October.
The 20 strongest daily declines in the Dow Jones
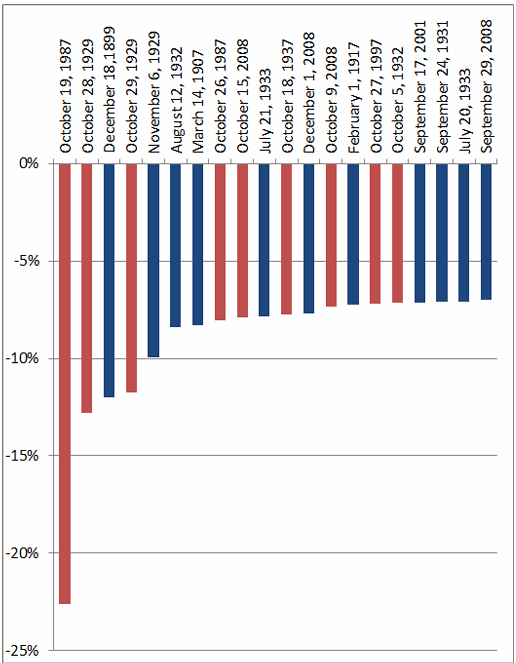
The Dow falls very often in October. Data source: Wikipedia, us.spindices.com
As you can see, 9 of the 20 sharpest declines took place in October. That is way out of proportion. Clearly October has a tendency to have a lot of sharp price drops.
Extreme courses are also real
In contrast, the situation was quite different in the first half of the year: in those 6 months there were only 2 out of the 20 sharpest declines.
So, October’s bad reputation is not unfounded.
However, apart from the extremes, how does October perform on average?
October runs sideways
To examine this, let’s look at the seasonal chart of the Dow Jones over an extended period. Unlike the usual charts, a seasonal chart does not show you the price over a specific period of time. Rather, it shows the average trend over many years depending on the season. In this instance, mean values are formed from the prices of 124 years. The horizontal axis of the chart shows the time of year, the vertical axis shows price information. The chart therefore shows the typical seasonal price trend at a glance.
Dow Jones, seasonal trend, determined over 124 years
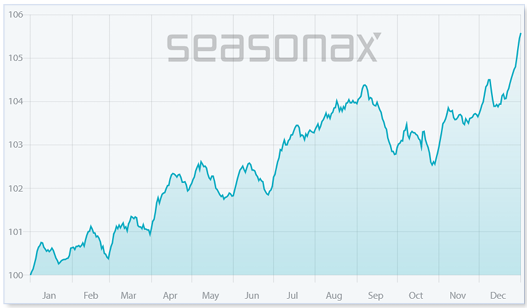
On average, October goes sideways. Source: Seasonax
As you can see, it is in fact September, and not October, that is the weakest month. The latter in fact runs sideways overall (although admittedly this is below average).
October’s bad reputation therefore stems from particularly strong declines, which actually occur more frequently in October. They affect individual days, but can also have an impact on the entire month.
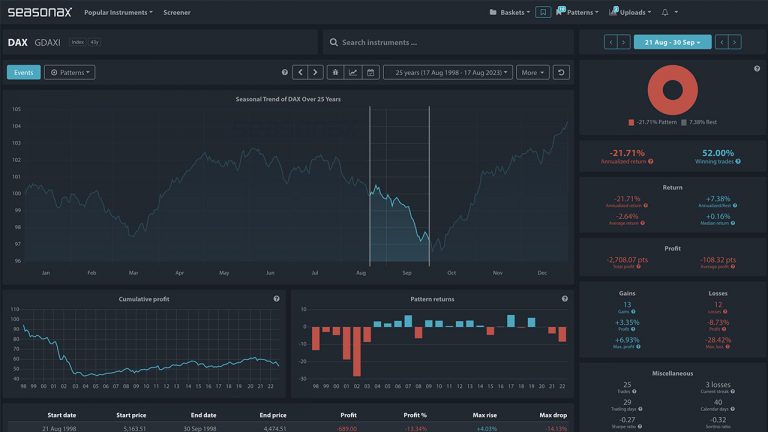
You can not only view seasonal trends with Seasonax, but also detailed statistics.
To do this, select an instrument and mark a period with your cursor – for example, October. Then you will find evaluations for the individual years below. In this way you can also optimise your portfolio by avoiding extreme risks!
Kind regards,
Dimitri Speck
Founder and Head Analyst of Seasonax
PS: Reduce your risks with seasonal analyses!