Dear Investor,
August is widely known for its scorching heat and languid days. However, it often carries with it a unique behavioral pattern in the stock market. Historically, August has seen softer market movements, lighter trading volumes, and frequently a certain degree of pullback. But what factors contribute to this trend?
Peering into historical data reveals August as a month where the stock market might, metaphorically speaking, be sipping a chilled lemonade by the pool. Heavyweights like the S&P 500 and Dow Jones, usually humming with transactions, display a summer slumber. Contrary to other months, that may see pronounced market movements spurred by quarterly earnings or macroeconomic indicators, August remains relatively quiescent. But why?
Decoding the Historical Data: Factors Influencing August’s Stock Behavior
Obviously, this stock market rhythm isn’t just about “summer laziness”. Several underlying factors anchor August’s unique market behavior.
With traders’ jet-setting for holidays, trading desks see fewer action-packed days. Low trading volumes can make the market sway more dramatically, adding an element of surprise – volatility! Europe, in particular, sees a vast majority of its population take vacations in August. Given the interconnected nature of global markets, reduced activity from European institutional investors can impact the U.S. market’s liquidity and momentum.
Moreover, historically, September carries the notorious title of being one of the worst-performing months for stocks. As August winds down, there is a growing anticipation of this potential downturn, which can create a self-fulfilling prophecy of cautious investment strategies and reduced exposure.
Interestingly, the S&P 500 has a recurrent weak patch from August 1 to October 11. Analyzing the past 15 years, during this phase the S&P 500 has recorded an average dip of 0.56%.
Seasonal Chart of S&P 500 Index over the past 15 years
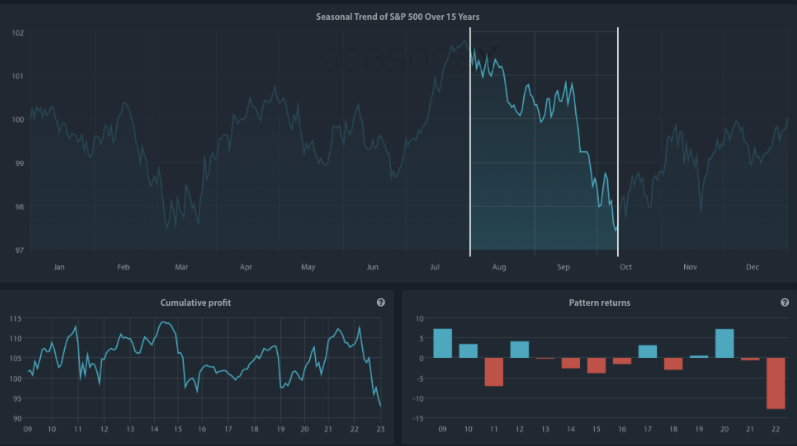
Source: Seasonax – Click the link below to access an interactive chart.
http://tiny.cc/Seasonax-SPX
Keep in mind that a seasonal chart depicts the average price pattern of a specific asset in the course of a calendar year, calculated over several years (unlike a standard price chart that simply shows prices over a specific time period). The horizontal axis depicts the time of the year, while the vertical axis shows the % change in the price (indexed to 100). The prices reflect end of day prices and do not include daily price fluctuations.
August Exceptions: The Outliers
Nevertheless, like all trends, there have been exceptions. Despite the seasonal slowdown often observed in August and September, there are always outliers in the stock market that buck the trend. Certain stocks, driven by unique catalysts or strong sector fundamentals, manage to post impressive gains even during these typically languid months.
Currently, what seems to drive this optimistic market sentiment is a combination of encouraging mid-year earnings and the Federal Reserve’s successful inflation curbing, all without triggering a recession. Also, the rise in the number of S&P 500 stocks surpassing their 200-day moving average signals a bullish market. Nevertheless, diversifying investments, especially in growing economies like Japan and India, might be a strategic move.
One notable example is TVS Motor Company, a well-known name in the Indian automotive scene. Investors often monitor this company as a barometer for the health and trajectory of the two-wheeler segment in the region.
Seasonal Chart of TVS Motor Company over the past 10 years
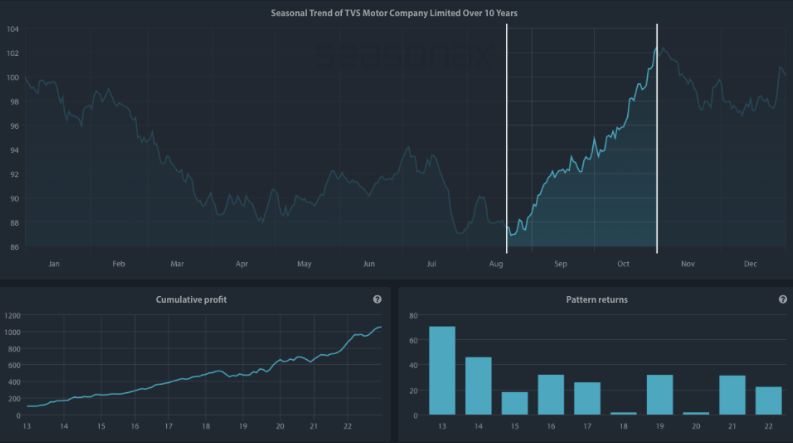
Source: Seasonax – Click the link below to access an interactive chart.
http://tiny.cc/Seasonax-TVSMotor
A quick look at the seasonal chart above is enough to see substantial peaks during August and September. What is even more astonishing is that this two-wheeler manufacturer has been delivering results like clockwork. Over the last ten years, from August 20 to October 31, there’s been a remarkable 26.87% surge within a short span of 49 trading days.
Remember, past performance is not indicative of future results. However, the significance of these recurring peaks cannot be discounted. Since 2013 this stock has recorded a 100%-win streak, putting a smile on its investors faces.
Another interesting stock for those looking to gauge the pulse of high-end retail in the Land of the Rising Sun is Isetan Mitsukoshi Holdings.
Seasonal Chart of Isetan Mitsukoshi Holdings Ltd over the past 10 years
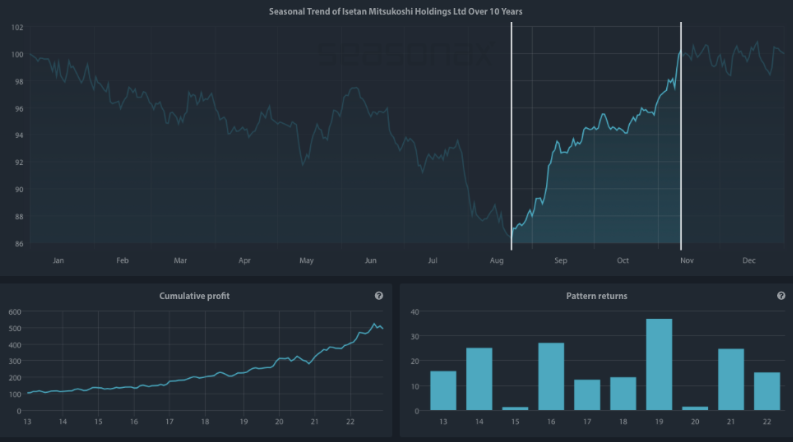
Source: Seasonax – Click the link below to access an interactive chart.
http://tiny.cc/Seasonax-IsetanMitsukoshi
Over the past decade, Isetan Mitsukoshi Holdings Ltd has showcased a remarkably consistent seasonal trend. Specifically, from August 22 to November 12, the stock has demonstrated a compelling trajectory. On average, investors have reaped a robust 16.86% return during this window, and impressively, this trend boasts a stellar 100% success rate.
The fundamental reasons can be found in the fact that during these months the company often rolls out effective marketing campaigns, targeting holiday shoppers and autumn festivals, leading to heightened investor interest.
Moreover, Japan witnesses a surge in tourism during the fall, leading to increased footfall in their retail outlets and a corresponding spike in revenue.
Wherever you choose to invest, whether in Japanese, Indian or US stocks, or anywhere else, be sure to leverage Seasonax to identify the optimal entry and exit points based on recurring patterns. When you sign up for free at www.seasonax.com, you can access over 25,000 instruments, encompassing various sectors, stocks, (crypto)currencies, commodities, and indices.
Remember, don’t just trade it, Seasonax it!
Yours sincerely,
Tea Muratovic
Co-Founder and Managing Partner of Seasonax