Dear Investor,
Undoubtedly the economy has experienced a severe rollercoaster this year. The uncertainty has not diminished and financial markets are still heavily influenced by the corona-virus, government stimulus plans, elections and valuations. We will continue to face many risks going forward.
Nevertheless, historical market performance suggests that investor sentiment should improve in coming weeks. As I already showed in the last issue of Seasonal Insights, the major US stock indexes tend to move sharply before the elections. But there is also another strong effect, namely the autumn rally.
Will there be a late autumn rally in stocks?
To examine forthcoming seasonal opportunities I have analyzed the tech sector which usually delivers strong seasonal gains around this time of the year.
The first illustration below depicts a seasonal chart of the NASDAX Index. The chart was created by calculating the average returns of all years since 1985 and thus shows the typical seasonal pattern of the NASDAQ Index in the course of a calendar year. The horizontal axis denotes the time of the year, the vertical axis the level of the seasonal index.
Seasonal pattern of the NASDAQ Index over the past 35 years
The NASDAQ Index typically delivers strong seasonal returns during last quarter.
Source: Seasonax (click here to highlight the above mentioned period on the chart and have a closer look at a detailed statistical analysis of the pattern)
I have highlighted the strong seasonal phase from October 27 to December 6. In this time span of just over one month, the NASDAQ Index rose on average by 5.31 percent.
On an annualized basis this is equivalent to quite a large gain of 60.5 percent! By way of comparison: in the remainder of the year the NASDAQ Index generated an average annualized gain of less than 9 percent.
Even more important is the pronounced consistency of the positive returns generated during this phase, which suggests that this pattern is highly reliable.
NASDAQ pattern returns in every single year since 1985
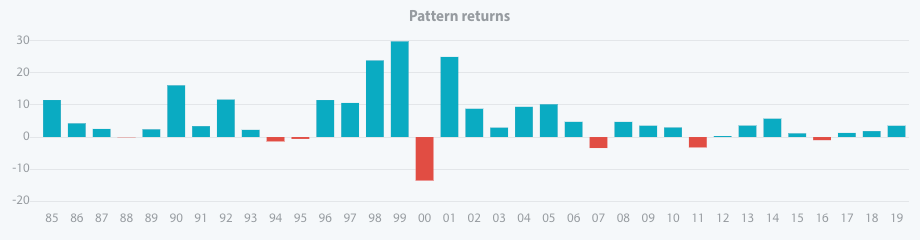
Pattern returns since 1985 look very appealing (blue bars indicate years with positive returns and red bars represent losses).
By removing the statistical outliers (in this case dotcom bubble in 2000) you can review an even more nuanced analysis with the help of our seasonal charts.
Reasons behind the trend
One of the drivers of the surge in stocks in coming months is the retail sector and the upcoming holiday shopping season. Amazon’s Prime Day was just one of the sales events that have unleashed additional spending. Next in line is Black Friday, which is also set to contribute to driving stock prices up.
As mentioned above, the second driver consists of the upcoming elections. Prior to an election sentiment improves, as people hope for their candidate’s victory and a fresh impulse is expected from the new team in the White House. This optimism, even if it is caused by something unrelated to stocks, stimulates buying interest.
Seasonal opportunities in individual stocks
There are many individual stocks entering a period of seasonal strength in coming months. Some of them have already entered it as we speak.
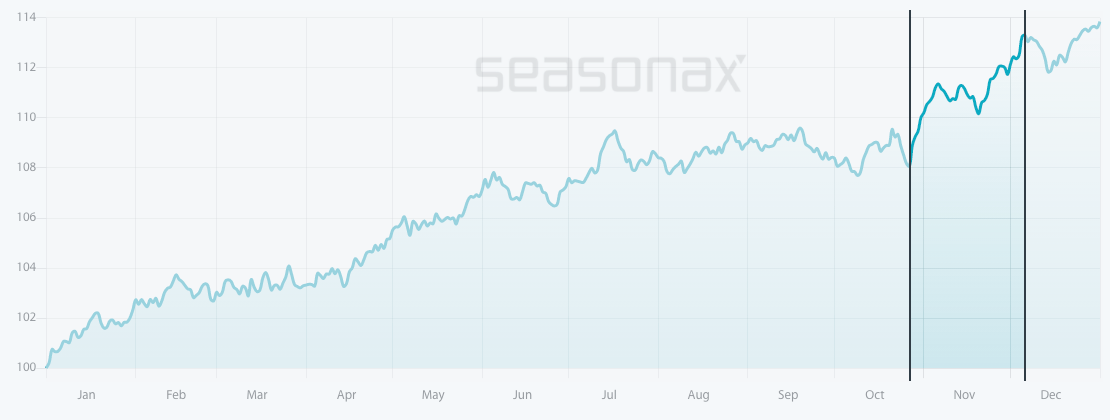
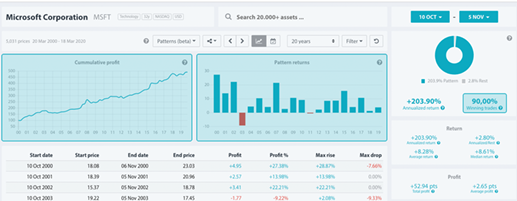
One example is Microsoft. I have highlighted the strong seasonal phase from October 10 to November 5. On average Microsoft has delivered a very strong annualized return of 203.90% during this period.
Even more important is the high frequency with which the positive returns generated through the last 20 years have recurred.
From a fundamental perspective, the consistency of this pattern is mainly due to earnings surprises which typically drive the stock’s price up in the last quarter.
Seasonal pattern of Microsoft over the past 20 years
Microsoft typically delivers strong seasonal returns during the month of October.
Source: Seasonax (click here to highlight the above mentioned period on the chart and have a closer look at a detailed statistical analysis of the pattern)
Whether the trend will continue in 2020 cannot be predicted with certainty, but seasonality allows us to determine the probability of certain price moves. As a trading strategy, it is one of just a few approaches that are statistically verifiable. Since the calendar-based drivers underlying seasonal trends are independent of other driving factors, seasonality consistently creates added value for investors from a statistical perspective. In other words, you can use seasonality and make use of statistical probability and pattern recurrence in addition to the trading approaches you have employed hitherto.
Enter the world of seasonal opportunities
Apart from the stocks and indexes we have presented in this issue of Seasonal Insights, there are numerous other individual stocks that display recurring seasonal trends that are starting right now.
The most profitable trades are just few mouse clicks away!
Yours sincerely,
Tea Muratovic
Co-Founder and Managing Partner of Seasonax