Dear Investor,
Warmer weather is approaching and the summer season is getting ever closer. In the month of May, many investors are remembering the old market saying „Sell in May and go Away“- and are contemplating their positioning during the summer months. In one of our past issues of Seasonal Insights we have analysed this phenomen in detail by analysing the half-year results of the eleven largest stock markets by market capitalization. The study underscores that seasonal weakness in the summer months – also known as the “Halloween Effect” – indeed exists.
However, are there still hidden gems that can be found in this time period? Or the whole industry has gone short?
The Beverage Study
It can be safely assumed that the stock market is on average significantly weaker from May until the end of October than during the rest of the year. But there are still several sectors that are benefiting substantially from the upcoming summer season, and one of them stands out in particular.
According to Slice Intelligence, the summer and winter seasons have a significant impact on the annual sales of various beverages. In the warmer months, sales of energy drinks, sport drinks, soft drinks and beer increase. During the winter season there are spikes in tea, wine and spirits consumption. These trends can be clearly seen in the chart below.
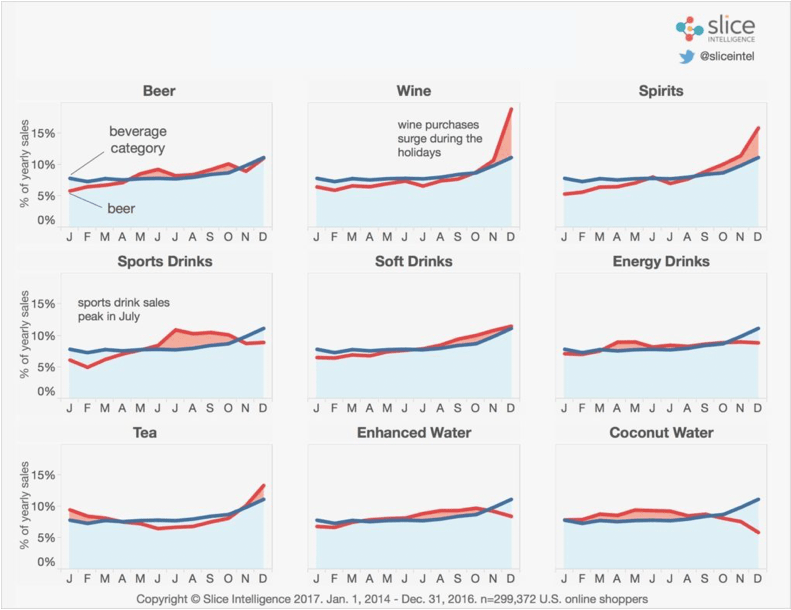
Source: Slice Intelligence
Beverage Stocks on the Radar
Energy and sports drinks are definitely becoming a summer staple and Monster Beverage Corporation is an outstanding representative of this product category.
Monster Beverage Corporation is an American beverage company that manufactures energy drinks including Monster Energy, Relentless and Burn.
According to T4’s market research team Monster held nearly 39% of the $57 billion US energy drinks market in 2020.
Seasonal Chart of Monster Beverage Corporation over the past 10 years
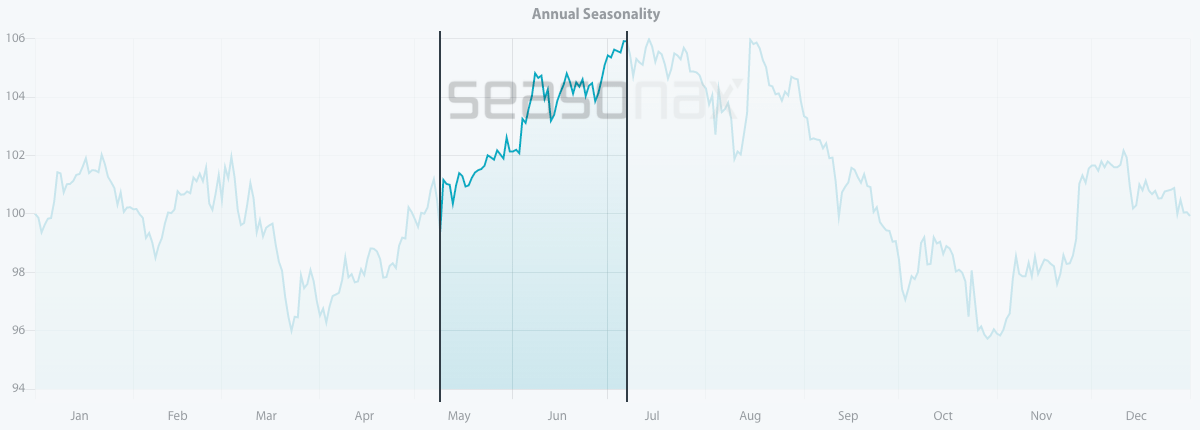
Source: Seasonax – by clicking on the chart image you can highlight the above mentioned time period on the chart and take a closer look at a detailed statistical analysis of the pattern
The increased summer demand for energy drinks can be clearly discerned in the seasonal chart of Monster Beverage. The stock enters a strong seasonal period from the end of March until the beginning of July. Let us take a closer look at the statistics.
Keep in mind that unlike a standard price chart that simply shows stock prices over a specific time period, a seasonal chart depicts the average price pattern of a stock in the course of a calendar year, calculated over several years. The horizontal axis depicts the time of the year, while the vertical axis shows the level of the seasonal pattern (indexed to 100).
I have highlighted the upcoming strong seasonal phase from May 9 to July 7 calculated over the past 10 years. In this time span of 41 trading days, the shares of Monster rose on average by a remarkable 10.03 percent. Furthermore, the frequency of positive returns generated over time during this phase indicates that this seasonal pattern is consistent and highly reliable. The bar chart below depicts the return delivered by Monster in the highlighted time period from May 9 to July 7 in every single year since 2011.
Pattern return for every year since 2011
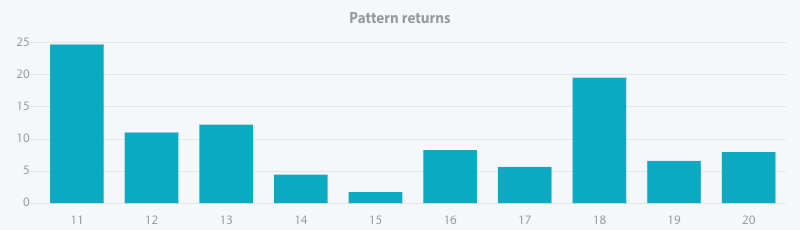
Source: Seasonax – please click on the link to conduct further analysis
Furthermore, the red line overlay in the seasonal chart shows the stock price movement in the current year 2021. It can be clearly seen that the seasonal trend has already started in March. The question is: will the rally momentum last until July?
Another refreshing stock that I have analysed is National Beverage Corp. – the fifth largest soft drink company in the United States.
Seasonal Chart of National Beverage Corp over the past 10 years
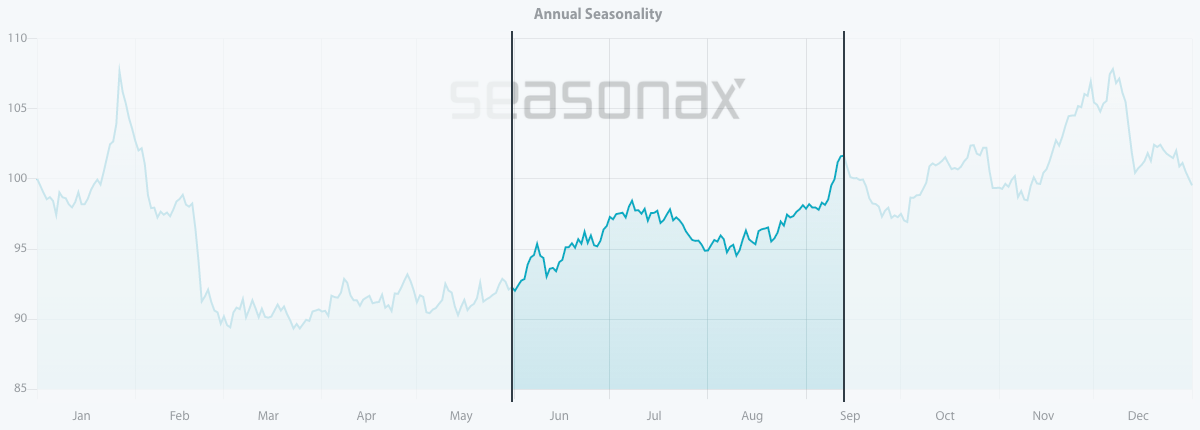
Source: Seasonax – please click on the interactive chart to conduct further analysis
Over the past 10 years National Beverage Corp. has entered into a strong seasonal period from May 31 to September 13. In this time span of 74 trading days, the shares rose on average by 15.51 percent. Moreover, the pattern returns in that period have been consistent and positive since 2011.
Warm weather has an immediate impact on sales as people shop for refreshing drinks to cool down. Moreover, it is well known fact that defensive sectors outpace the market during the summer months. Therefore, rather than simply selling positions, sector rotation could be a sensible alternative.
Another beverage that reaches its sales and consumption peak during the summer months is beer.
An excellent example for our purposes is provided by The Boston Beer Company which has grown to be the second-largest craft brewery in the United States.
This stock displays a great seasonal phase from June 4 until August 16 with a stunning average return of 15.85 percent during this brief time period.
Seasonal Chart of The Boston Beer Company over the past 10 years
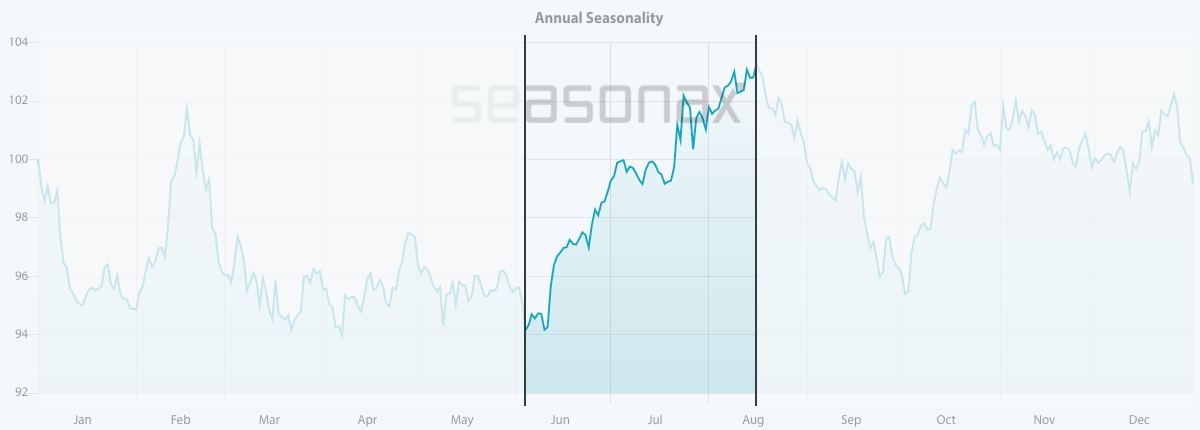
Source: Seasonax – please click on the chart to conduct further analysis
The Thirsty Season Has Begun
However, there is also another major factor that has been driving the markets for the past year – namely COVID-19. The pandemic has left bad taste in our mouth; the lack of sales in restaurants during the lockdown periods affected the beverage industry badly.
But every day a larger number of people is getting vaccinated the economy and our lifestyles are getting back to normal. Beverage stocks will be getting their momentum back when bars and restaurants open up around the world.
Is now the right time to take a position? That is something that you have to figure out by yourself! But do not forget to take the strong seasonal drivers into your consideration.
Timing is Everything!
Apart from the stocks I have presented in this issue of Seasonal Insights, there are numerous other stocks that display recurring seasonal patterns.
To make finding these opportunities even easier, we have launched a Seasonality Screener. The screener is an analytical tool designed to identify trading opportunities with above-average profit potential starting from a specific date. The algorithms behind the screener are based on predictable seasonal patterns that recur almost every calendar year.
Feel free to analyze more than 20.000+ instruments including stocks, (crypto)currencies, commodities, indexes by signing up for a free trial.
Yours sincerely,
Tea Muratovic
Co-Founder and Managing Partner of Seasonax