
Dear Investor,
The major world stock indices have been seeing drops due to uncertainty around the global coronavirus pandemic, while the volatility has been rising steadily since the middle of February as the virus began to spread around the world.
Numerous business conferences have been cancelled and travel plans disrupted, negatively impacting airlines, cruise lines, casinos, hotels and restaurants.
Most of the stocks have lost their ground and are currently trading at low prices.
The questions arise: How can we profit from the current situation and are there still hidden gems in the stock market?
Hidden Gems, Stay-at-home Stocks
The theme of working remotely, working from home, living from home, keeping socially distant but embracing social media, is making a trend.All these services that allow you to function as normal of a lifestyle as you possibly can within the confines of your house are going to be here to stay for quite some time.Is the answer to our question hiding in so-called “stay-at-home stocks”?
In this Seasonal Insights we have analyzed two different stocks and have added seasonal factor as additional potential performance booster.
Being able to identify these seasonal phases in time can therefore provide an especially strong edge to investors.To illustrate this point more clearly, I’d like to draw your attention to one such stock: Take-Two Interactive Software, Inc. The company owns two major publishing labels, Rockstar Games and 2K, which operate internal game development studios. Take-Two’s portfolio includes numerous successful video game series across personal computer and video game consoles.
Unlike an ordinary price chart that simply shows the stock price over a specific period, a seasonal chart depicts the average price pattern of a specific stock in the course of a calendar year, calculated over a number of years. The horizontal axis depicts the time of the year, while on the vertical one you can see the level of the seasonal pattern (indexed to 100). With that in mind, let’s examine the seasonal chart of Take-Two Interactive Software below, showing its seasonal patterns over the last 10 years.
Take-Two Interactive Software, seasonal pattern over the past 10 years
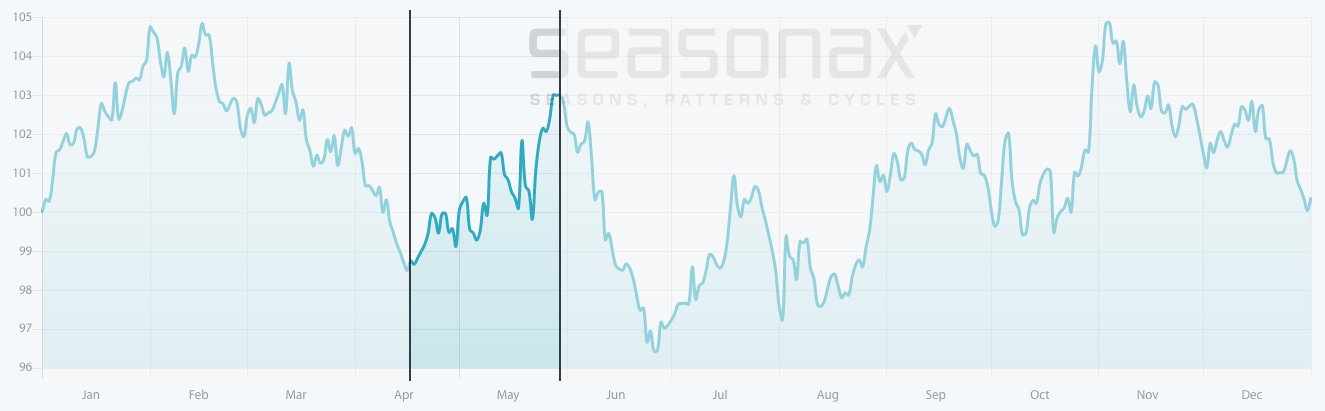
Take-Two Interactive Software typically delivers strong gains from mid-April to end of May.
Source: Seasonax (click here to analyze the pattern)
As you can see, I have highlighted a strong seasonal phase, from April 17 to May 30. On average, during this period, Take-Two Interactive Software has delivered returns over 7.71%, which corresponds to a very decent annualized gain of 87.40%.What’s even more important, is that these positive returns during this phase are very consistent too, thereby making the pattern more reliable.
Take-Two Interactive Software rose in 9 out of 10 cases
The bar chart below depicts the return delivered by Take-Two Interactive shares in the relevant time period from April 17 to May 30 in every year since 2010. Red bars indicate years in which negative returns were generated, blue bars indicate years with positive returns.
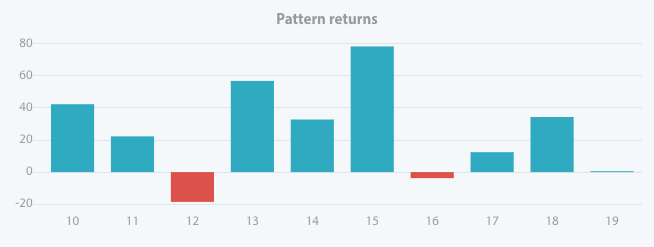
Take-Two Interactive Software typically delivers strong gains from mid-April to end of May.
Source: Seasonax (click here to analyze the pattern)
Beginning of Netflix Era
Second Stay-at-Home Stock that we have chosen is Netflix, Inc. – an American media-services provider and production company. The company’s primary business is its subscription-based streaming service which offers online streaming of a library of films and television programs, including those produced in-house.
Netflix is “a key beneficiary” of the change in behavior the pandemic has prompted, with the outbreak causing more people to stay at home and stream more video. Netflix has seen a spike in downloads for its app in regions that have been hit hard by the coronavirus, a trend that could point to higher international demand.
Netflix, seasonal pattern over the past 10 years
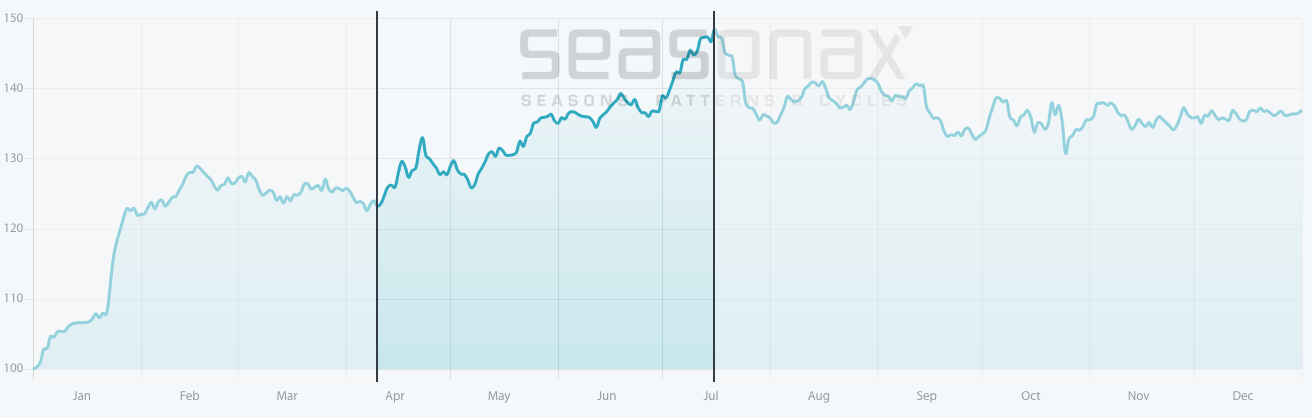
Netflix typically delivers strong gains from mid-April to mid-July.
Source: Seasonax (click here to analyze the pattern)
I have highlighted the especially strong seasonal phase from April 10 to July 16 in blue. In this time period Netflix displays a particularly strong seasonal advance. The average gain achieved in this period amounted to 22.63%. This corresponds to an extremely strong annualized gain of 115.43%!
The following bar chart shows the pattern return for the time period April 10 to July 16 in every single year since 2010.

Netflix typically delivers strong gains from mid-April to mid-July.
Source: Seasonax (click here to analyze the pattern)
Find unique opportunities with seasonal patterns
As you can see from our examples, individual stocks often enjoy phases of seasonal strength, regardless of what is happening to the rest of the market. There are still many great opportunities to be found even during challenging times.
Yours sincerely,
Tea Muratovic
Co-Founder and Managing Partner of Seasonax