Dear Investor,
In recent years, markets have been conditioned not to overreact to political and geopolitical shocks for two reasons: firstly, because it was believed that the initial shock would not increase significantly more; and secondly, because central banks were willing and able to suppress financial volatility.
Whilst analysing the latest geopolitical situation, I came across an interesting study conducted by LPL Research. This study has taken into account 22 major geopolitical events and their influence on the S&P 500. Following these market shocks, the total drawdown of the S&P 500 averaged around 5%.
Markets quickly digest everything that is thrown at them. The S&P500 needed less that 45 calendar days on average to recover its losses.
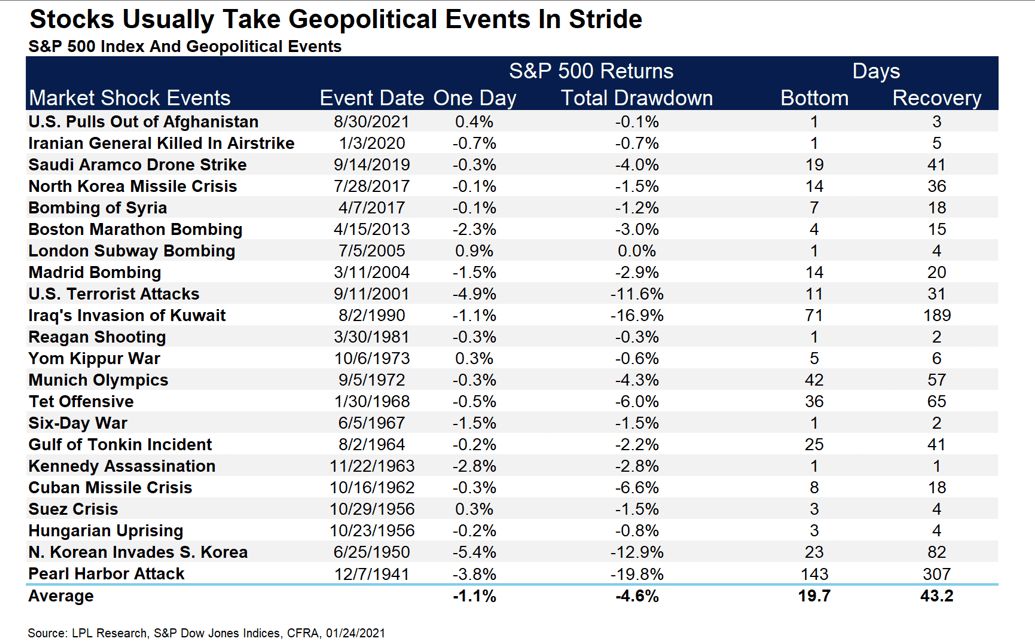
Nevertheless, there are also larger conflicts in sensitive regions, such as Iraq’s invasion of Kuwait, that US stock markets have had more of a struggle to recover from. The question is, can we draw conclusions from them for the present day?
While the current market reaction is likely to be more acute than the response to Russia’s illegal annexation of Crimea in 2014, the attack on American interest is less direct than the Kuwait situation.
The question of whether recovery will be in line with estimations will depend on consumer and corporate earnings and recession, among other factors. If earnings continue to be strong, there will be no signs of recession, and therefore this recent market weakness could be seen as a potential opportunity for investors.
Defense stocks on the seasonal radar
Single stock seasonality is not just a random event that enters the scene out of the blue. Individual stocks exhibit distinct seasonal patterns, either due to internal business reasons, or on account of various external drivers.
Seasonality, therefore, presents itself as one more factor that we should take account of when analysing the current geopolitical situation. The logical consequence of political tensions and war is that money flows into the defense sector. The United States and Europe have already raised their military spending on the back of the Russian invasion of Ukraine.
Is there a window of opportunity where we can combine fundamentals, technical analysis and good old logic?
I have put the seasonality of various defense stocks under the microscope.
One defense giant that I came across is Teledyne, an engineering and tech firm that produces high-end electronics and hardware. These are used in a variety of civilian and defense-related applications such as cameras, control instrumentation, aircraft information management systems and defense satellite communications equipment. Teledyne operates in the US and Canada, along with the UK and Western Europe.
Seasonal Chart of Teledyne Technologies Inc over the past 10 years
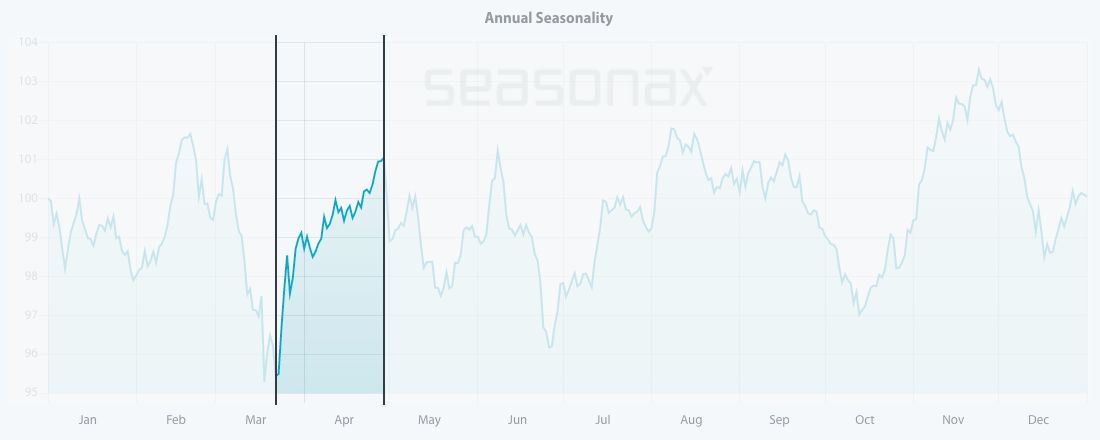
Source: Seasonax
Don’t forget that by clicking on the link you can analyze the highlighted time period and take a closer look at a detailed statistical analysis of the pattern.
I have highlighted the strong seasonal phase from March 22 to April 29 calculated over the past 10 years. In this time span of 27 trading days, the shares of Teledyne rose on average by 7.96%. Will the current situation lead to a repeat of historical stock gains?
Keep in mind that, unlike a standard price chart that simply shows stock prices over a specific time period, a seasonal chart depicts the average price pattern of a stock in the course of a calendar year, calculated over several years. The horizontal axis depicts the time of the year, while the vertical axis shows the level of the seasonal pattern (indexed to 100).
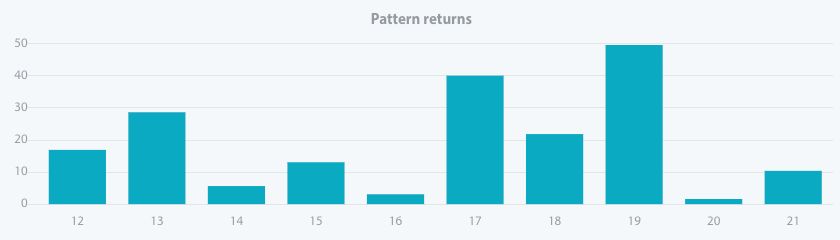
The frequency of positive returns generated over time during this phase indicates that this seasonal pattern is consistent and highly reliable. The bar chart below depicts the return delivered by Teledyne in the highlighted time period from March 22 to April 29 in every single year since 2012.
Pattern return for every year since 2012
Source: Seasonax
The second stock that caught my attention is Kratos Defense. This company designs and develops a wide range of platforms and products for its customer base, from unmanned aircraft to satellite communication systems, to cybersecurity and cyber warfare systems to hypersonic technology.
The stock of Kratos Defense enters a strong seasonal period from the beginning of May until mid-July. Let us take a closer look at the statistics.
Seasonal Chart of Kratos Defense over the past 10 years
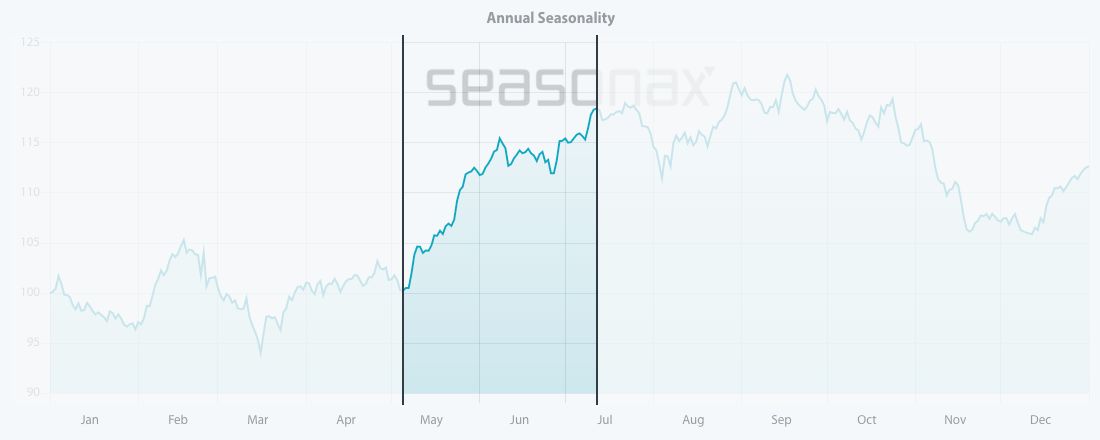
Source: Seasonax – click on the link to conduct further analysis
Over the past 10 years Kratos Defense has entered into a strong seasonal period from May 5 to July 12. In this time span of 47 trading days, the shares rose on average by an astonishing 18.17%. Moreover, the pattern returns since 2012 have been positive for every single year.
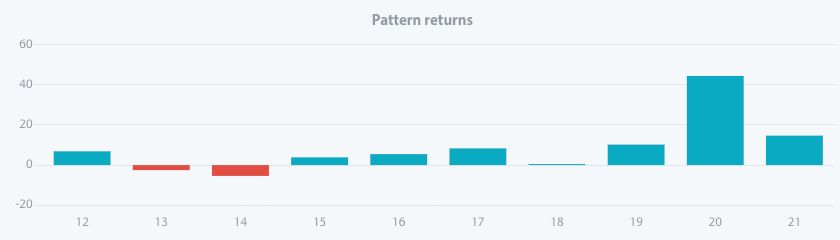
Pattern return for every year since 2012
Source: Seasonax – click on the link to conduct further analysis
In addition to the stocks that I have presented, there are numerous other stocks and sectors that display recurring seasonal patterns and are in high demand when geopolitical situations gets shaky.
To make finding these opportunities even easier, we have launched a Seasonality Screener. The screener is an analytical tool designed to identify trading opportunities with above-average profit potential starting from a specific date. The algorithms behind the screener are based on predictable seasonal patterns that recur almost every calendar year.
Feel free to analyze more than 25.000+ instruments including stocks, (crypto)currencies, commodities, indexes by signing up to a free trial.
Yours sincerely,
Tea Muratovic
Co-Founder and Managing Partner of Seasonax