Dear Investor,
The economy has undoubtedly faced a severe rollercoaster last year. 2020 has shaken and stirred us in every imaginable way. Thus many people have been waiting for 2021 to press the restart button. Naturally, the current situation won’t suddenly make a u-turn, but at least there is a light in the end of the tunnel. Light in the form of a vaccine, but also in the form of sustainability and the green economy, which have been on our radar for quite some time.
In 2020 we have become more conscious regarding health care and self-care. Changes in behavior have given a boost so called stay-at-home stocks, as well as of companies in the areas of sports, clean eating, clean beauty products and renewables.
I have dedicated this issue of Seasonal Insights to companies that are contributing to cleaner living and have climbed their way up on various sustainability lists.
Green and clean
The green economy and clean living already accompany us in many spheres of life. In the financial sector clean revenue is derived from interest income from renewable energy loans. In the consumer discretionary sector Tesla is definitely leading the pack in electric mobility and energy efficient products.
The consumer staples sector is gaining sales revenue from organic cosmetics and personal care products. 85% of Alphabet’s total revenue consists of clean income.
One thing is clear – the green economy presents an alternative vision for growth and development and is here to stay.
Is the trend your friend?
To be able to survive in coming years companies will have to switch to sustainable resources to an even greater extent than hitherto. Some are already well on the way, but some are still lagging way behind.
Seasonality and sustainability are actually a good match as well. Seasonality is defined as recurring patterns that are the consequence of repeating market or corporate events. Sustainability can reinforce the effects of these events on the level of individual companies.
When analyzing seasonality one can therefore definitely include the sustainability factor as an additional portfolio parameter.
The companies I have analyzed have made significant strides toward contributing to an environmentally sound economy and have made their way onto this year’s Forbes sustainability list.
With that in mind, let us start with our analysis.
Please note, unlike a standard price chart that simply shows stock prices over a specific time period, a seasonal chart depicts the average price pattern of a stock in the course of a calendar year, calculated over several years. The horizontal axis depicts the time of the year, while the vertical axis shows the level of the seasonal pattern (indexed to 100).
Unilever PLC, along with its Dutch counterpart, Unilever N.V., constitutes a global food, personal care, and household products powerhouse. The group’s vast portfolio of consumer products includes more than a dozen global brands.
The stock of Unilever enters a strong seasonal period in the first half of the year. Let us take a closer look at the statistics.
Seasonal Chart of Unilever plc over the past 10 years
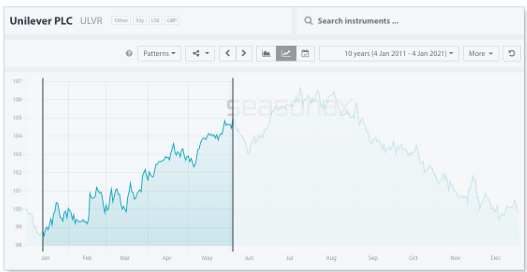
Unilever plc typically delivers strong seasonal in the first half of the year
Source: Seasonax
Don’t forget that by clicking on the chart image you can highlight the above mentioned time period on the chart and take a closer look at a detailed statistical analysis of the pattern.
I have highlighted the strong seasonal phase from January 13 to June 3 calculated over the past 10 years. In this time span of 100 trading days, shares of Unilever plc rose on average by 11.47 percent. Furthermore, the frequency of positive returns generated over time during this phase indicates that the seasonal pattern is consistent and highly reliable. The bar chart below depicts the return delivered by Unilever plc in the relevant time period from January 13 to June 3 in every year since 2010. Blue bars indicate years with positive returns.
Pattern return for every year since 2010
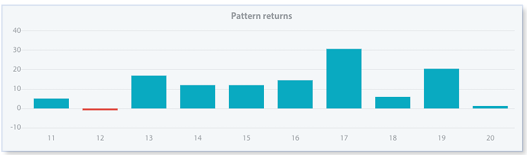
Source: Seasonax – click here to examine a detailed statistical analysis of the pattern
Another company the seasonality of which is aligned with that of Unilever is global cosmetics manufacturer L’Oréal.
L’Oréal has exhibited a strong seasonal period in the past 10 years during the first 6 months of the year, or to be more precise, from January 14 until May 28. Use our interactive seasonal chart below to see a detailed analysis of this seasonal pattern:
Seasonal Chart of L’Oreal over the past 10 years
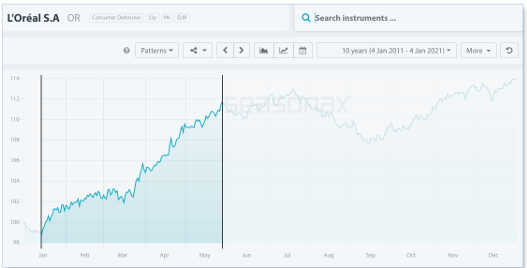
Source: Seasonax – Please click on the interactive chart to conduct further analysis
Short-term seasonality
For short-term traders I present Autodesk, which is placed among the top 5 on Forbes sustainability list this year. Autodesk is a leading provider of computer-aided design software, offering a broad portfolio of 3D computer-aided design (CAD) applications and tools.
Seasonal Chart of Autodesk over the past 10 years
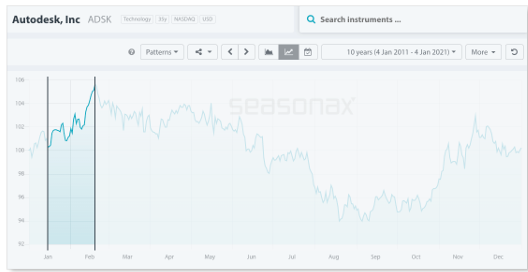
Source: Seasonax – Please click on our interactive chart to conduct further analysis
I have highlighted the strong seasonal phase from January 15 to February 19. On average Autodesk has delivered quite strong returns of 7.81% during this period in the last 10 years, which corresponds to a very respectable annualized gain of 119.25%.
Even more astonishing is the fact that in the past 10 years Autodesk did not generate any losses in the highlighted period.
One thing is certain – the green/clean economy theme will remain with us in coming years. You should therefore check out the Green Scene and make the most of the trading opportunities it offers.
Enter the world of seasonal opportunities
Apart from the stocks I have presented in this issue of Seasonal Insights, there are numerous other stocks that display recurring seasonal patterns.
To make finding these opportunities even easier, we have launched a Seasonality Screener.
The Seasonality Screener is a tool designed to identify trading opportunities with above-average profit potential based on predictable seasonal patterns that recur almost every calendar year. The Screener is an integral part of your Seasonax subscription and calculates seasonal patterns for profitable trades starting from a specific date. Find the most profitable trades with just 2 mouse clicks TODAY!
Yours sincerely,
Tea Muratovic
Co-Founder and Managing Partner of Seasonax