
Dear Investor,
You can probably imagine that I am convinced of the merits of seasonality. However, even I was surprised that an investment strategy based on seasonality is apparently leaving numerous far more popular strategies in the dust.
And yet, this is exactly what a recent comprehensive scientific study asserts – a study that probably considers a longer time span than most: it examines up to 217 years of market history!
Why is the length of the time period so important? If you compare investment strategies as a practitioner, you may well look at just the past year, for a simple reason: in day-to-day business, there is pressure to quickly generate short-term profits. If your interest is more academic, you will probably be inclined to consider several years.
200+ years study provides conclusive results
However, every investment strategy has its ups and downs in the short term. Even the best strategy can occasionally underperform and the worst one can take the lead. If you dismiss the objectively best strategy because it has underperformed over the past year, your investment results are bound to suffer.
That is why it is important to examine time series that are as long as possible – it is the best way to identify long-term market drivers.
That is exactly what researchers Guido Baltussen and Laurens Swinkels from Erasmus University in Rotterdam together with Robeco analyst Pim van Vliet have recently done in a study (“Global Factor Premiums”, SSRN id 3325720). Some of the data they used date back as far as 1799!
Not only did the data cover long time periods, the researchers also looked at a plethora of different time series: they examined 68 markets drawn from four asset classes. These comprised equities, bonds, currencies and commodities.
Six strategies put to the test
In these markets the authors of the study compare the following investment strategies:
- BAB(betting against beta): low volatility investments are preferred.
- Value: the strategy is based on the idea that fundamentally cheap securities will generate better long term returns than expensive ones.
- Momentum: in the “cross-sectional momentum” strategy securities are purchased which have achieved the largest outperformance compared to the rest of the market over the past 3 to 12 months (the number of securities held is largely kept stable).
- Carry: In this strategy securities that offer large yields independent of their price performance in the form of dividend or interest payments are preferred.
- Trend: in contrast to the momentum strategy, the main criterion for comparison in this strategy is a security’s own past performance: securities are purchased if they have performed well in the past (the number of securities held fluctuates).
- Seasonality: purchases of securities are timed to coincide with particularly favorable seasonal trends.
As you can see, the researchers included the most popular investment strategies in their comprehensive study.
Seasonality is the best investment strategy for a multi-asset portfolio
But what was the study’s conclusion? Take a look at the following bar chart. It shows the excess returns (Jensen’s alpha) of the six strategies across all four asset classes (multi-asset) with their 68 individual markets over the entire time period examined.
200+ years study: excess returns of a multi-asset portfolio
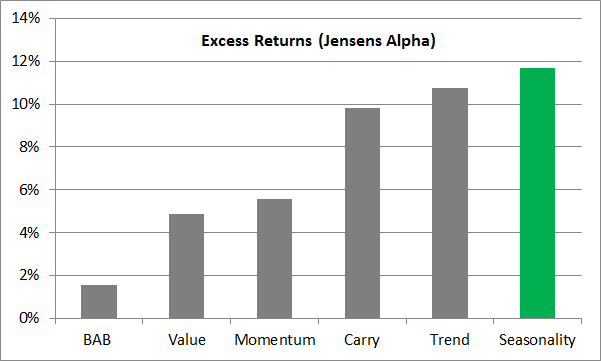
Seasonality beats all other strategies! Sources: Guido Baltussen, Laurens Swinkels, Pim van Vliet
Illustration: Seasonax
As you can see, an investment strategy based on seasonal trends beats all other strategies! This is all the more remarkable considering that globally very little is invested in products that employ seasonality-based strategies.
The situation is quite different in e.g. the case of the popular value investment strategy: hundreds of billions of US dollars are invested in this strategy – but its returns are trailing far behind.
Conclusion: think for yourself rather than following the herd. Take seasonality into account!
Seasonality also leads in terms of risk-adjusted returns
Let me present another conclusion of the study. The table below inter alia shows the annualized Sharpe ratios [1] of the different strategies, which are a measure of the risk they entail.
The table underscores the excellent performance of the seasonality-based investment strategy.
200+ years study: key metrics of a multi-asset portfolio
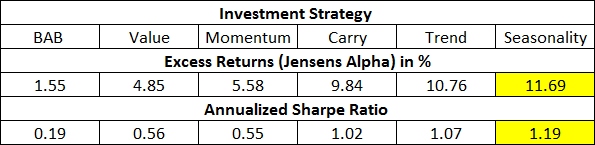
The seasonality-based strategy leads in terms of risk-adjusted returns as well. Sources: Guido Baltussen, Laurens Swinkels, Pim van Vliet Illustration: Seasonax
[1]The Sharpe ratio is named after its inventor, Nobel laureate William Sharpe. It represents a portfolio’s average return in excess of the risk-free rate per unit of volatility (formula: (return of the portfolio – return of the risk-free rate)/standard deviation of the portfolio’s excess return). The greater the Sharpe ratio, the more attractive the risk-adjusted return.
Consider seasonality with respect to stocks and bonds as well!
The study furthermore contradicts a common preconception according to which seasonality is only useful for trading in commodities. It actually shows that seasonality generates above-average returns in three of the four asset classes examined, namely in equities, bonds andcommodities. It evidently pays to jettison common preconceptions!
Take advantage of seasonality professionally!
The study encompassing 200+ years and 68 markets underscores that a seasonality-based investment strategy indeed works. In fact, it actually leaves far more popular strategies in the dust – what more could one want as an investor?
What’s more, there remains scope for improving the seasonal approach used in the study. For example, the strategy employed in the study progresses on a monthly basis. But what if e.g. the price of a specific stock tends to rise from the middle of one month to the middle of the next month?
It would obviously make more sense to align trades in such a stock with these mid-month turning points.
With the aid of the precise daily seasonal charts provided by Seasonax, seasonal trends can be identified at a glance. In addition, detailed statistics on seasonal patterns are accessible with a single mouse click. Simply navigate to app.seasonax.com, where numerous instruments can be examined free of charge, or to your Seasonax app on Bloomberg or Thomson Reuters.