Dear Investor,
The screener is one of the most popular features of the Seasonax app. With just a few clicks, it identifies the stocks, commodities, or currencies with the most promising seasonal prospects for the coming weeks or months.
This allows you to take advantage of seasonality without having to spend many hours a day analyzing the markets, as is often the case with other investment strategies.
Today I’d like to explain one feature of the Screener: the ranking, which is used to display the Screener’s results by default.
The Seasonax Screener Ranking
As a reminder: You can access the screener at the top of Seasonax. First, select the index, such as the NASDAQ 100, the EuroStoxx 50, or the HDAX, from which you want to choose your stocks. You can adjust settings such as the start date on which you want to enter the position, the investment horizon (the planned duration of your investment), and the length of the seasonal pattern.
The names of the stocks will then be sorted and displayed. At the top of the list are the stocks that are about to enter a favorable seasonal phase and therefore represent a promising investment opportunity. Let’s take a look at such a list with the screener’s results.
Seasonax Screener
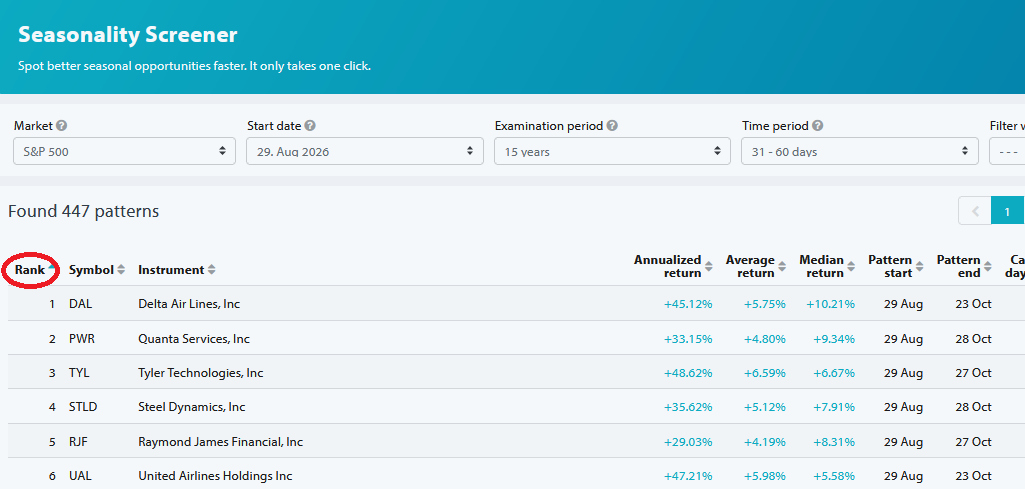
By default, the list is sorted by “rank.” You can change this as you wish and sort the stocks, for example, by average return, median return, or Sharpe ratio. At first glance, it seems obvious to choose such a direct measure of performance. After all, as investors, we want to generate returns. However, the sorting method behind the default “Rank” setting is somewhat more complex and is based on three metrics and for good reason.
The rank is based on three metrics
What if the list were sorted by return rather than by rank? In that case, stocks that have risen sharply in recent years would tend to come to the forefront. Stocks that have been in a downtrend would have little chance of appearing at the top of the list. The ranking would reflect not only seasonal patterns but also the strength of past trends.
I therefore conducted extensive back-testing to determine which metrics are useful for predicting future price movements. This back-testing included a so-called walk-forward approach as well as an out-of-sample approach. In this process, the computer simulates a scenario in the past, for example, the year 2000 and trades during that year using only information from previous years, specifically up to 1999. This approach was then verified using data that had not been used previously, such as Canadian or Japanese stocks instead of U.S. stocks.
It turned out that the already strong results from sorting by return could be improved even further. Therefore, in addition to the average return, the trend-adjusted return and the annualized return are also used in the screener ranking. The trend-adjusted return adjusts the result for the past long-term trend. This ensures you receive good recommendations even when there is a shift in market favorites. This increases the likelihood that you will achieve good results over the long term. The annualized return makes seasonal patterns of varying lengths comparable. This reduces the tendency of the average return to be skewed toward longer patterns. Otherwise, these patterns would skew the results upward without leading to better outcomes for you as an investor in your overall portfolio.
The ranking is therefore determined by three metrics: average return, trend-adjusted return, and annualized return. Based on these three metrics, the screener makes recommendations that offer you a higher probability of rising prices in the coming weeks or months.
As you can see, here at Seasonax, we strive to deliver the best results for you, even when it comes to seemingly minor details.
This provides you with strong support for your long-term investment success, all in a matter of seconds.
Best regards,
Dimitri Speck
Founder and Chief Analyst at Seasonax
P.S.: Use the screener to help you succeed in your investments!