Dear Investor,
The publication date of this issue coincides with the start of spring, which brings life back to nature.
Do you also want to sprint and make big profits?
But I am not talking about speculative shares or even leveraged instruments.
Rather, it is about statistical methods to systematically increase performance opportunities.
One such method is seasonality. It allows you to select instruments that are seasonally promising in the coming weeks or months. One of them: Adidas.
Seasonality helps you with the selection
Take a look at the seasonal chart. It shows you the typical seasonal development of the share price of Adidas, the well-known German sporting goods manufacturer, over the past 25 years.
Adidas, seasonal trend, calculated over 25 years
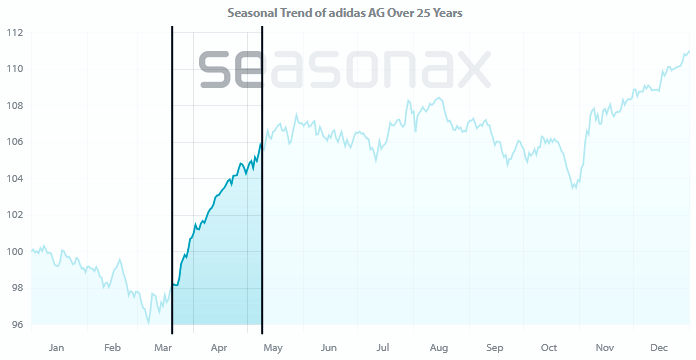
Adidas sprints off at the start of spring. Source: Seasonax
As you can see, Adidas is sprinting off seasonally at the start of spring – I have marked the seasonally good area.
In the past 25 years, the share price has risen in 23 out of 25 cases between March 20 and May 9. This corresponds to a high hit rate of 92%!
The annualized performance is also very good at 71.73%. You can, as ever, discover other key figures in a flash by logging into Seasonax, calling up the instrument, and marking the seasonally good phase with the mouse.
Think beyond spring – roll from one seasonal opportunity into the next!
However, regardless of whether you opt for Adidas or another seasonally promising instrument: Every seasonal phase expires once. In the case of Adidas, on May 9.
Then don’t despair – choose the next seasonal opportunities!
So when a good seasonal phase comes to an end, you roll into the next instrument. And then into the one after that.
I would like to show you this schematically. Assume instrument A has its good seasonal phase (with +11%) from January to February, instrument B from March to April, instrument C afterwards, and so on.
You can combine these yields by switching from one instrument to the next, and lining up the seasonal patterns.
So you first invest in the seasonally attractive instrument A, then in instrument B, then in instrument C and so on.
The illustration below shows you the increase in yield schematically:
Cascading seasonal yield, schematic
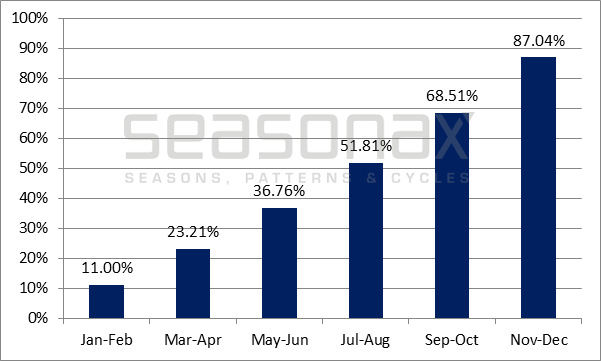
Cascading helps to increase yields. Source: Seasonax
Taking into account the compound interest effect, the example shows a return of +87.04% per year.
In reality, of course, things don’t happen so regularly on the stock market. This is a schematic representation of how returns are combined by rolling.
Find your seasonal items quickly with the screener!
We have developed the Screener so that you can find good seasonal patterns quickly.
You can find it at the top of Seasonax:
Seasonax screenshot
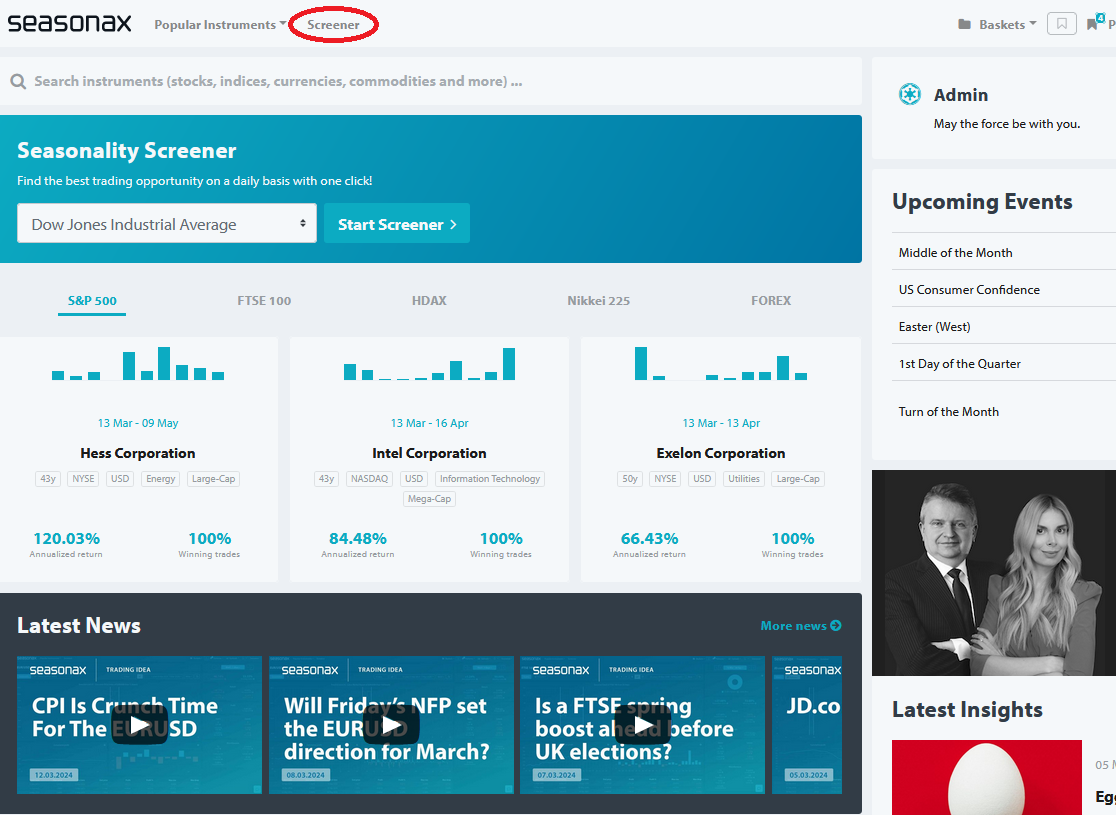
You can find the screener in the menu above. Source: Seasonax
With the screener, you can choose the right instruments to suit your personal requirements.
You can do this with just a few mouse clicks, because at Seasonax we don’t want you to spend your valuable time on unnecessarily complicated methods.
Of course, we don’t mind if you take a longer look around Seasonax. After all, that’s why we have developed all the features!
However, above all we want you to be successful with your investments!
Therefore, systematically take advantage of the seasonal opportunities available to you at any time of the year!
Best regards,
Dimitri Speck
PS: Sprint with the right instruments in every season!