Dear Investor,
In 2011, the Journal of Finance, the most influential academic financial journal at the time, published an award-winning study that examined the behavior of U.S. stock prices prior to FED meetings.
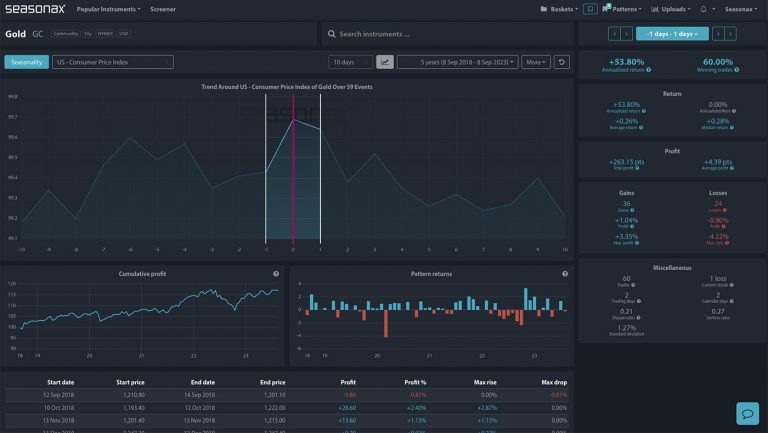
While I can’t promise you an award, I do have some very good news for you: from now on, you can perform event studies yourself with Seasonax in just a few mouse clicks.
This is due to how prices behave around FED meetings, holidays, labor market data or futures expiration days, which can be of great importance to you as an investor.
You can use this to optimize your buy and sell rates and, in individual cases, act accordingly.
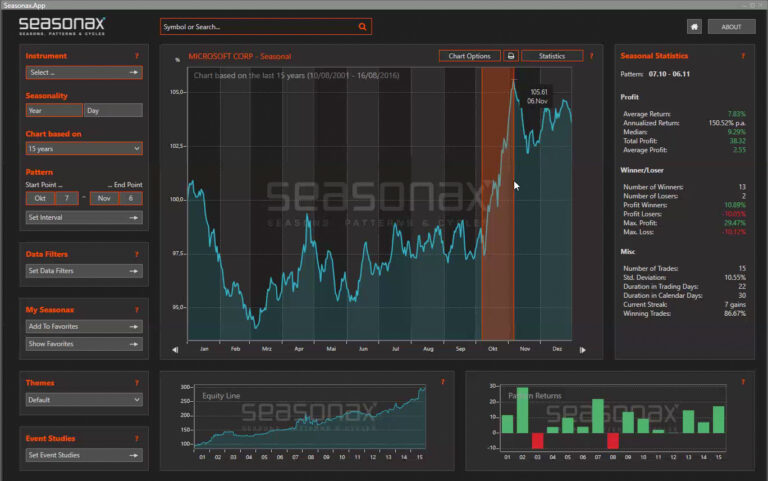
Example of an event study: FED meetings
Event studies are a brand new feature of Seasonax that can help you improve your investment results even more.
I would now like to show you what event studies are all about, using the example on which the above-mentioned award-winning article was based: meetings of the Federal Open Market Committee.
Eight times a year the Federal Open Market Committee (FOMC) of the U.S. Federal Reserve meets to discuss and decide on monetary policy, and the level of key interest rates.
So how do interest rate hikes affect the price of equities or currencies?
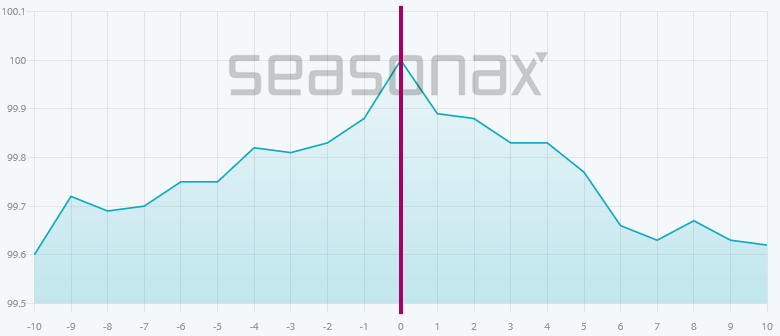
The FED meeting makes stock prices rise!
To answer this question, we can examine the impact on the S&P 500 by looking at the typical price of stock prices before and after the second day of the FED meeting. This is the day on which the interest rate decision is announced.
The event chart below shows you the average price of the S&P 500 in the 10 trading days before and after the second day of the FED meeting.
The chart was calculated over the past 25 years, during which there were 200 meetings. The horizontal axis shows the number of days before and after the second day of the relevant Fed meeting. The vertical axis shows you the average progression in percentage.
The red line in the middle marks this second day of the FED meeting. You can thus see at a glance of the event chart what the typical price of US stock prices around the important central bank meeting looks like.
Similar to the seasonal chart you are familiar with, an event chart shows an average progression, but just around the event rather than over the course of the year.
Average performance of the S&P 500 10 trading days before and after the second day of the FED meeting (1998 to 2022)
In the two days before, the S&P 500 rises particularly strongly. Source: Seasonax
As you can see, stock prices are already rising ahead of the announcement of the outcome of the FED meeting.
In the days thereafter, on the other hand, it continues in a general sideways direction – the mostly high tension of investors was not justified, at least with regard to this movement!
The order of magnitude involved is illustrated by the following calculation result: the two trading days up to the second day of the FED meeting combined a return that accounted for more than half of the total price gain of the stock market!
Since there are eight meetings a year, this means that in just these 16 trading days a larger profit was made than in the other 240 or so trading days of the year!
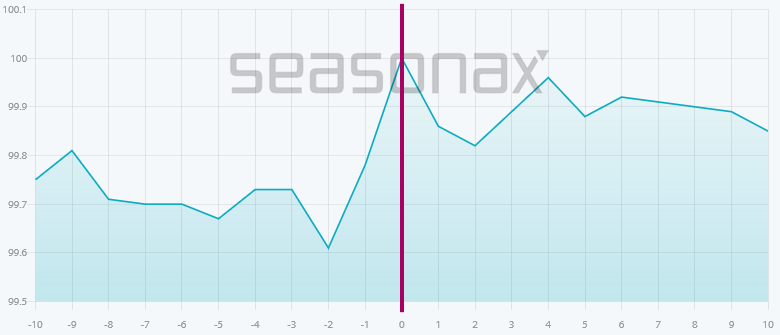
But what is the typical pattern around the FED meeting in other major markets? Let’s take a look at currencies, for example.
The FED meeting also significantly affects currencies!
The most important currency pair is the Euro against the US dollar. Take a look at the next event chart. It shows you the typical price trend of the Euro around the FED meeting, in the span of 10 trading days before and 10 days after the FED meeting. It was determined over 184 events – i.e. FED meetings – in 23 years.
Mean trend of the Euro against the U.S. dollar 10 trading days before and after the second day of the FED meeting (2000 to 2022)
The Euro rises to the FED meeting, then it drops! Source: Seasonax
You can clearly see how pronounced the pattern of the Euro against the U.S. dollar is around the FED meeting. The rate rises significantly towards the FED meeting. Afterwards, it goes down again just as strongly.
The turning point of the Euro/Dollar exchange rate takes place exactly on the second day of the FED meeting. This also illustrates the connection between the Fed meeting and the Euro/Dollar exchange rate.
How to make your own event study!
But how can you as a Seasonax user trade event studies for yourself? You can do it with just a few clicks:
1. Select an instrument, e.g. the S&P 500.
2. Click on “Events” in the upper left corner of the chart.
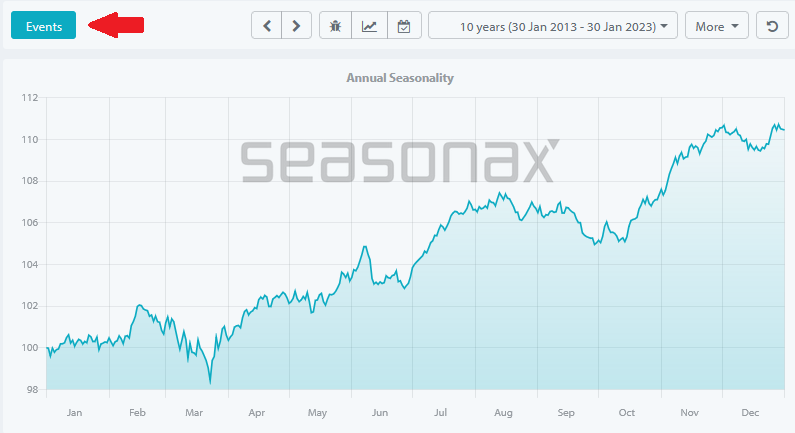
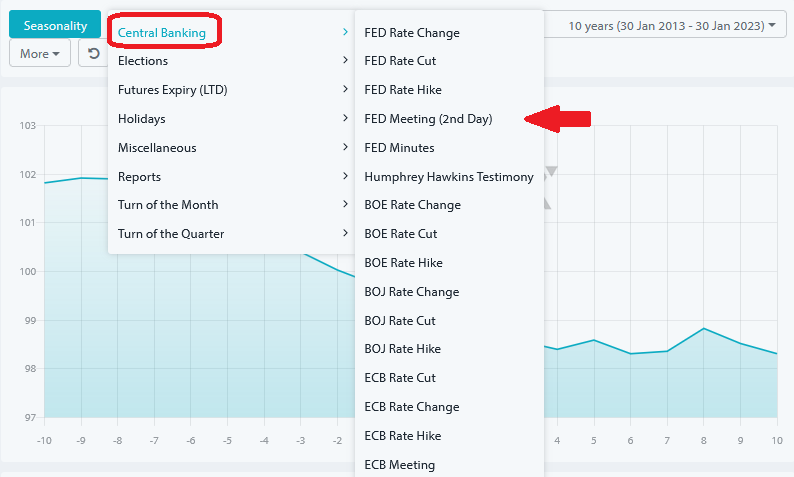
3. Select an event such as the FED meeting from the drop-down menu.
The event chart now shows you the average price trend of the instrument around the event. The red line in the middle marks the event, and to the left and right of it you see the trading days before and after.
Almost 100 events at Seasonax
You can now select a start and end point to examine a pattern in more detail. This is analogous to the detailed pattern analysis you know from the seasonal chart. This includes various statistics, the cumulative profit curve and the distribution chart.
Of course, it is not only the FED meeting that has an influence on prices, many other events do so too. In total, we have entered the data of almost 100 events from the following areas into Seasonax for you:
- Central Banking
- Elections
- Futures Expiry
- Holidays
- Miscellaneous
- Reports
- Turn of the month
- Turn of the quarter
This gives you a wide range of events to choose from: ranging from reports such as the CPI or labor market data, to futures expiration days such as triple witching days, to calendar events.
Of course, you can combine any event with any instrument, such as stocks, indices, currency pairs or commodities.
The event studies are a free additional offer for you as a Seasonax user – why don’t you try it out right now?
If you are afraid that the event studies will cost you extra: be happy, the event studies are an additional offer of Seasonax free of charge for our customers! The number of events available depends on the subscription plan you choose. Business users have free access to all events.
Take a look at www.seasonax.com right now! We would be pleased to hear your feedback.
Warm regards,
Dimitri Speck
Founder and Chief Analyst of Seasonax
PS: Event studies can offer you as an investor additional benefits!