Dear Investor,
As the end of the calendar year approaches, whispers of a stock market rally begin to circulate among investors and financial analysts. But is this so-called “year-end rally” a mere myth?
Historically, November and December have been particularly strong for the S&P 500 and DJIA. This period is often peppered with positive market trends, and seasoned with a general uptick in investor sentiment. Is this just mere holiday cheer?
Today, I will discuss various fundamentals that have strong influences on stock prices during the last weeks of the year.
Let’s start from the beginning. The Year-end rally, or the so-called ‘Santa Rally’, reflects the tendency of stocks to rally higher around the Christmas holidays. There have been a few favored explanations for this, including general optimism and good spirits around this time of year.
However, is this phenomenon just a fiction? Or is there something behind it?
The Santa Claus Rally starts in mid-December!
In search of proof, I went far back into history and analysed a seasonal chart of the Dow Jones Industrial Average Index.
Seasonal Chart of Dow Jones Industrial Average over the past 126 years
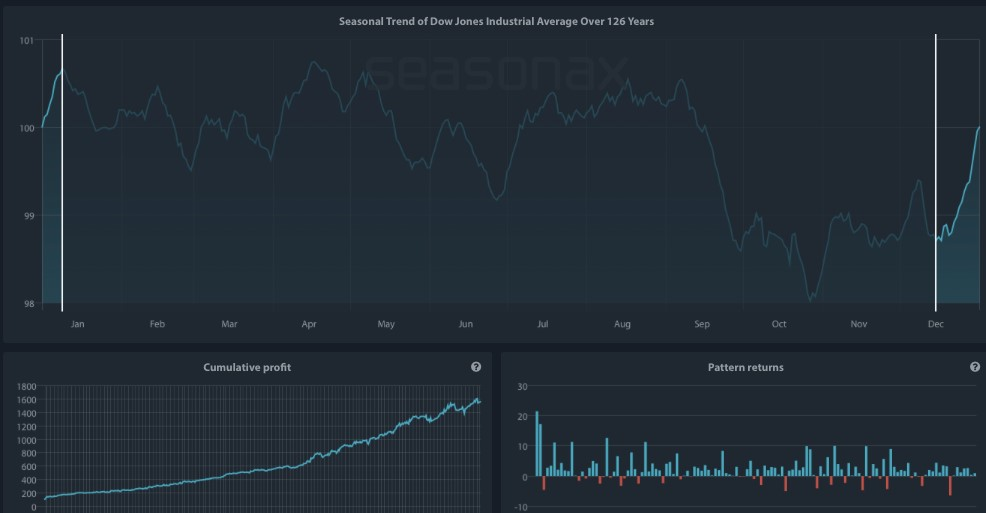
Source: Seasonax – Click the link http://tiny.cc/Seasonax-DowJones to access an interactive chart.
Unlike regular charts, a seasonal chart doesn’t display price over a set time, but shows the average trend over several years. The horizontal axis represents the time of the year, and the vertical axis shows the % change in price (indexed to 100). The prices reflect end of day prices and do not include daily price fluctuations.
Over the last 126 years, the Santa Claus Rally began on December 15 and typically ended on January 09 of the next year – highlighted in dark blue on the chart. I have used a detrended chart, removing long-term trends from the data to focus on seasonal or short-term patterns.
What is most astonishing is that the Santa Claus Rally generated an annualized return of 40.40% delivered in only 17 trading days.
For comparison: the average annualized gain of the Dow Jones Index during the rest of the time amounted to just 3.17%.
In short, the seasonal rally around the Christmas holidays is quite extraordinary. Moreover, looking at the pattern returns of every single year since 1898, prices rose in 77.78% of all cases (meaning that only 28 years out of 126 brought losses during the highlighted period). As this detailed breakdown of the Dow Jones illustrates, blue bars clearly dominate, both in frequency and extent.
Not only US Indices, but also Germany’s DAX has been seeing continued gains thanks to seasonal tailwind during the last month of the year.
Looking at the seasonal chart below, there has been a clear trend that starts on December 15th and lasts until January 9th. During this highlighted time period, over the last 43 years, DAX made an average return of over 2.5% in only 15 trading days. This has reoccurred 35 times since 1980.
Seasonal Chart of DAX over the past 43 years
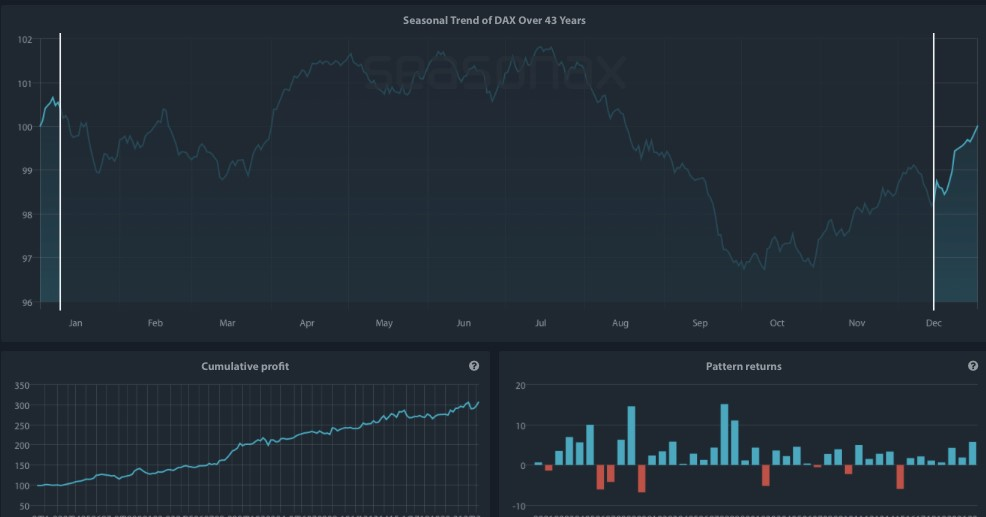
Source: Seasonax – Click the link http://tiny.cc/Seasonax-DAX to access an interactive chart.
What Drives the Santa Claus Rally?
There have been a few explanations for this seasonal phenomenon.
Window dressing by investment funds is an often cited reason for the end-of-year stock market rally. In other words, investment funds are supporting prices at the year-end in order to embellish their results, with the (purely coincidental but undoubtedly welcome) side-effect of boosting bonus payments, which are often calculated at the turn of the year.
However, although less obvious, psychological reasons are probably more often an important factor. These include the fact that most people tend to take stock at the end of the year and position themselves for the new year. In addition, there is the statistically significant holiday effect, which demonstrably tends to lead to stock market rallies ahead of other holidays as well.
This is a reason we all can relate to, as Christmas shopping and good spirits appear to be spilling over into the stock market as well.
Therefore before entering into Christmas mode, make use of Seasonax to identify best entry and exit points for your investments based on recurring patterns. By signing up for free to https://app.seasonax.com/signup, you will be able to scan for more than 25.000 instruments, including different sectors, stocks, (crypto)currencies, commodities, and indexes.
Remember, don’t just trade it, Seasonax it!
Yours sincerely,
Tea Muratovic
Co-Founder and Managing Partner of Seasonax