Dear Investor,
At the turn of the year 2021/22, you as an investor may be thinking about all kinds of things that can influence prices, but not about the US presidential election. After all, it took place in November 2020.
Nevertheless, the election is affecting share prices- and far beyond election day.
This is because it matters to the stock markets which year of the four-year election cycle we are in. The new year 2022 is a so-called “mid-term election year”. How does it perform in the four-year cycle?
The 4-year cycle influences the markets
The phenomenon called the 4-year election cycle differentiates not by party but by presidential election year. In the 121 years between 1900 and 2020, the Dow Jones rose by an average of about 6% if it was a presidential election year. In pre-election years, it did even better with about 9%. In the post-election years, on the other hand, it was only about 5%, and in the subsequent mid-term election years only about 1%. It is thus the worst year in the 4-year cycle.
The 4-year election cycle in detail
But what does the development look like in detail? Take a look at the average four-year development of the Dow Jones in the chart. This allows you to look closely at developments even within the cycle.
The scale on the right hand side shows returns in percentage terms. The horizontal scale shows the year in the four-year cycle.
Thus, above “Election” the average performance of all election years is shown, above “Post-Elect” that of all post-election years, above “Midterm” that of all mid-term election years, and above “Pre-Election” that of all pre-election years. The strong phases in the election cycle are marked with green arrows, the weak ones with red arrows.
Dow Jones, 4-year cycle, determined over 121 years
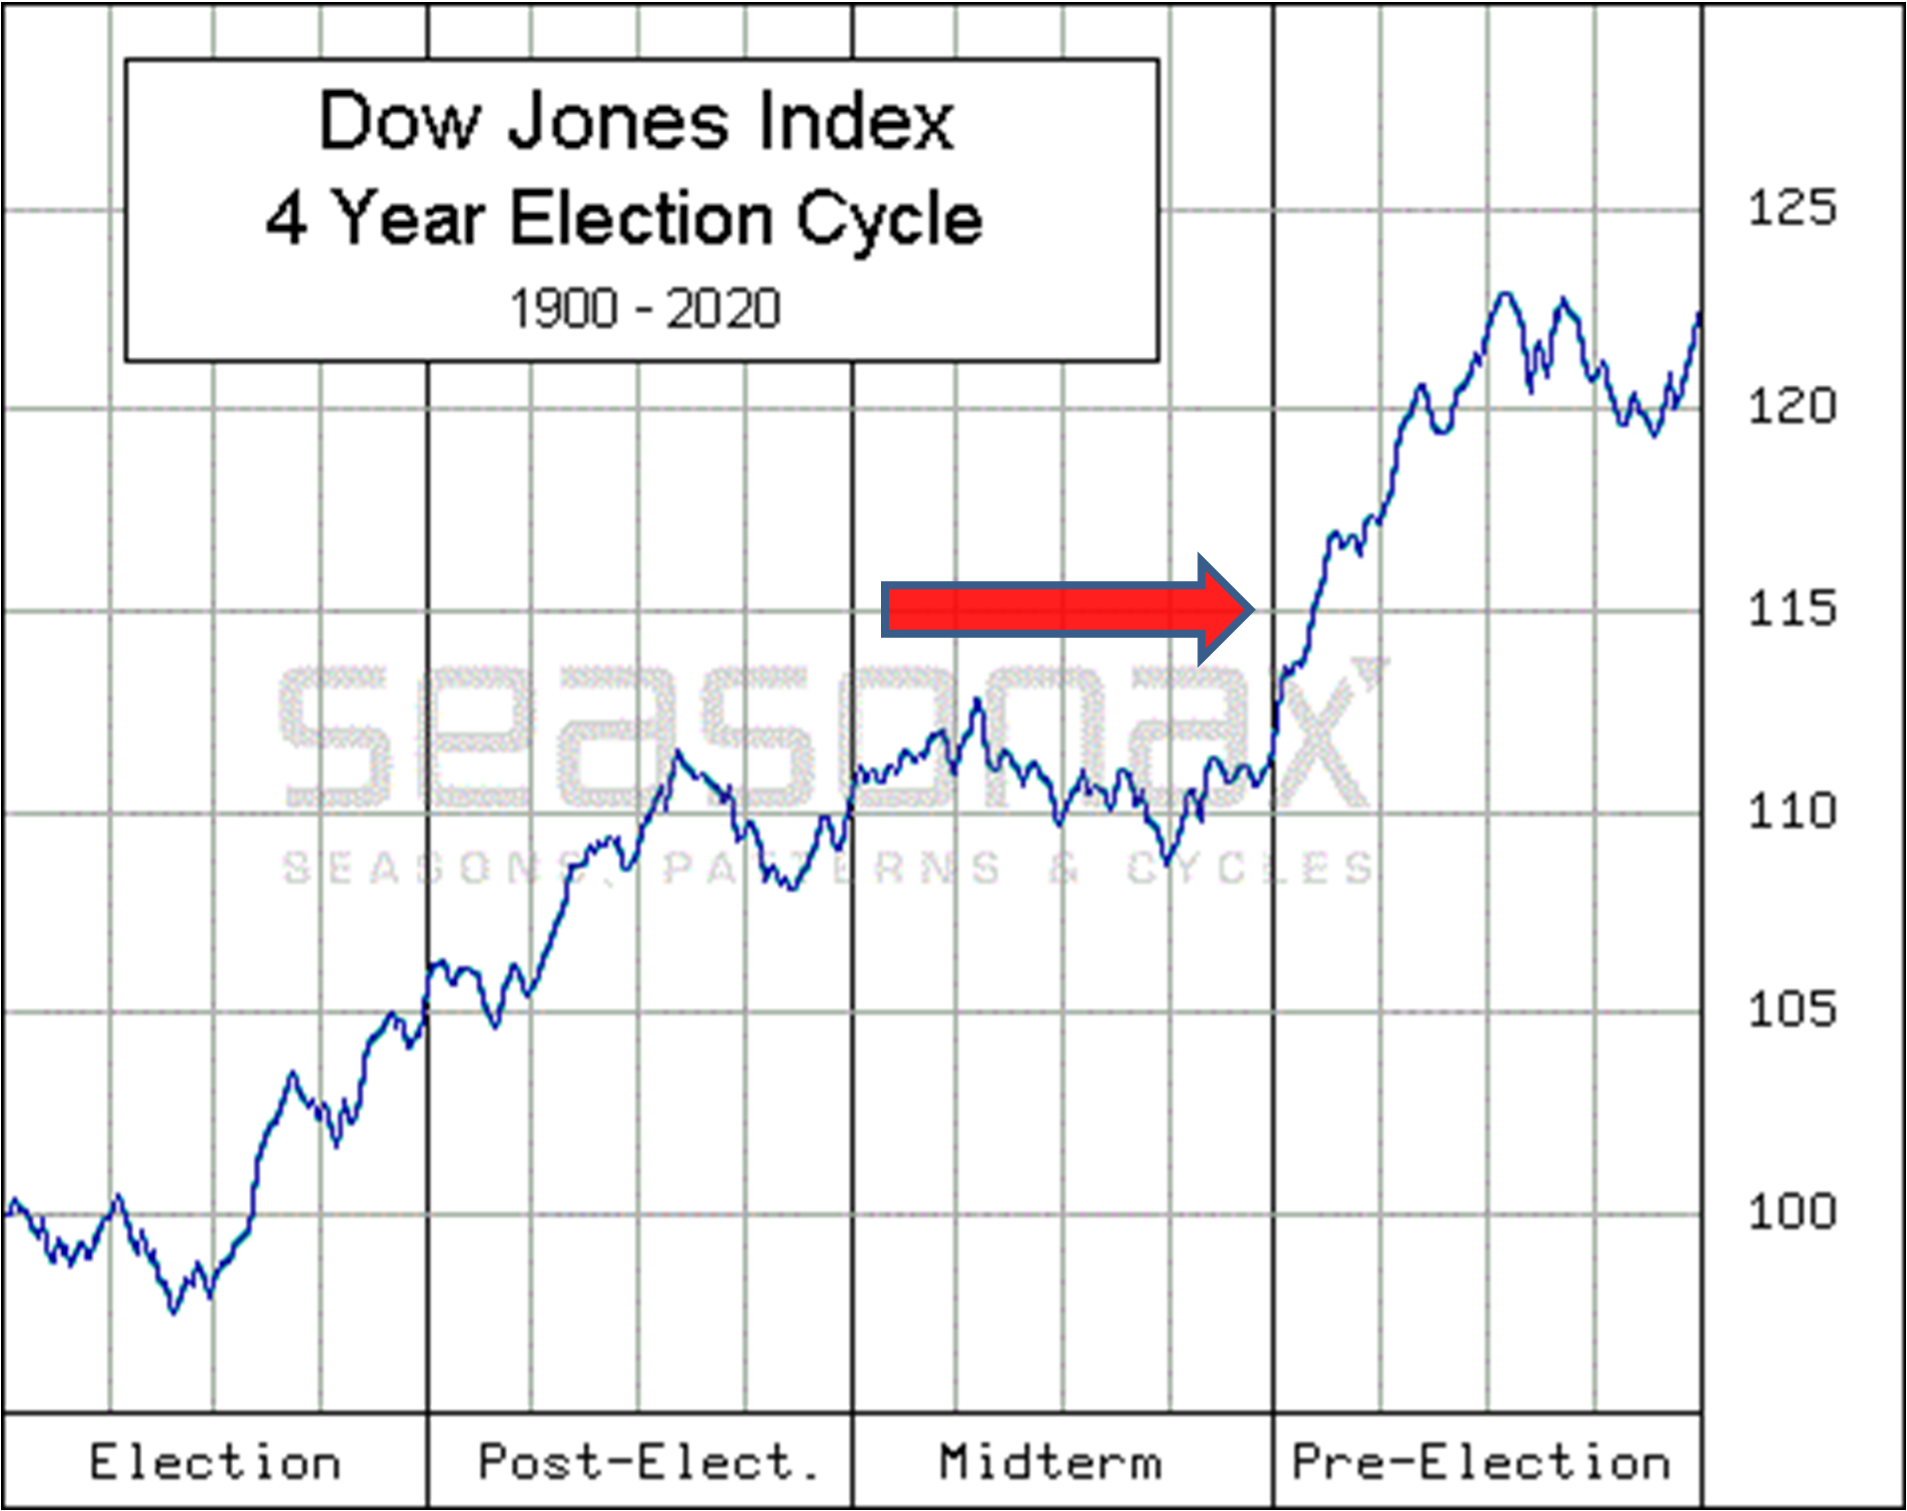
The midterm election year is typically underperforming. Source: Seasonax
As you can see from the final value of the scale, the increase over the entire four-year period averaged about 22%.
While the other three years of the cycle were more or less positive, the mid-term election year marked with a red arrow, on the other hand, hardly brought any gains for investors.
With 2022, such a year is now on the horizon. It threatens to be a relatively bad year for the stock market.
But are there reasons for the Dow Jones’ typical performance in the election cycle?
The reasons of the presidential election cycle
Presidents want to be re-elected or want a successor from their party. Before the election, they therefore try to stimulate the economy and make voters feel positive. This includes measures financed by deficit spending. Loose policies boost the markets.
But the central bank, which is not completely independent, also seems to support the president in office through its monetary policy.
After the election, on the other hand, unpopular measures are becoming more frequent, such as those to counter an escalating government deficit. This puts pressure on share prices. Such a tightening of monetary policy is now threatening again.
How to use the filter function on Seasonax
As you can see, with Seasonax you can investigate more than the mere annual seasonality. If you want to know how stocks, but also gold or the euro develop in a four-year cycle, call up the filter function!
Filter Function
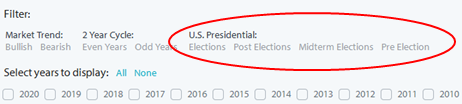
One click to the election cycle. Source: Seasonax
Even in difficult years there are good performers
The coming year threatens to be a below-average year for equities.
But you don’t need to despair because of this. Even in years when the overall market underperforms, there are sectors, individual stocks or even commodities that rise.
Seasonax will help you find them!
Best regards,
Dimitri Speck
Founder and Head Analyst of Seasonax
PS: With Seasonax you can find promising values even in difficult years!