Black Friday, one of the most anticipated non-official US holidays, will shortly be kicking off this year’s Christmas shopping season. Indeed, since 2005 Black Friday has reportedly been the busiest shopping day of the year in the States. Sales figures posted for this time period set the tone for the entire retail sector.
Black Friday falls to the first Friday after Thanksgiving. The term has its origins in accounting. When accounting records were kept by hand, red ink indicated a loss, and black a profit. Traditionally, during this period stores move from the “red” to the “black”. There are stock traders who associate Black Friday with the stock market collapse of September 24, 1869. The price of gold plummeted, and the markets crashed in the wake of a conspiracy between two investors, Jay Gould and James Fisk. However, in today’s issue we are discussing Black Friday in line with optimistic connotations!
The Battle for the Consumer Dollar Begins
For millions of people, Black Friday is the time to do some serious shopping. It embodies one of the most important retail and consumer spending events in the United States.
This holiday season is expected to bring in more than $51 billion, but changes in public health requirements, shutdowns, and supply chain factors mean things can change quickly. It also remains to be seen exactly how much the cost of living crisis impacts consumer spending over the Christmas season with many consumers likely to cut back as higher mortgage payments impact economic activity.
By offering various discounts and bargains, shopping retailers try to make their products even more appealing to potential customers. This year traditional retailers will again enjoy a comeback after the pandemic but will still need to navigate through new (post)pandemic rules. According to Adobe Shopping Trends and Holiday Report, buy-online-pickup-in-store services saw a sharp rise during 2020 and 2021. This trend is expected to continue throughout the 2022 holiday season.
From a statistical perspective, there is another clear upward trend in the S&P 500 Index shortly before and after Black Friday.
Seasonal Chart of the S&P 500 Index over the past 15 years
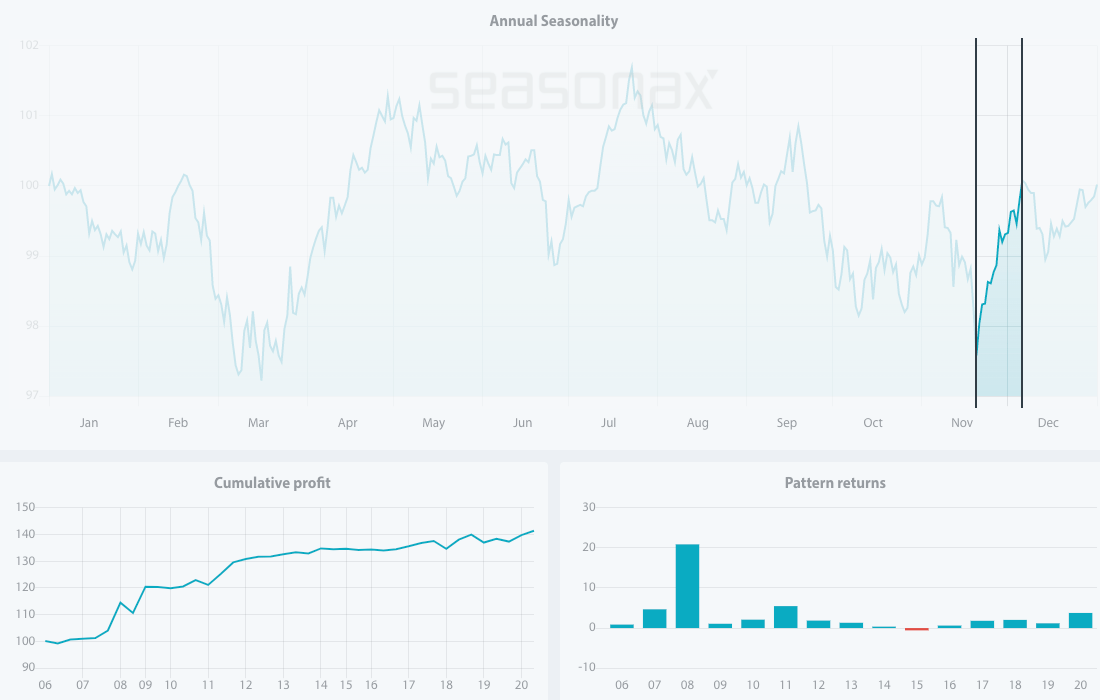
Source: http://tiny.cc/Seasonax-SPX500 to open an interactive chart to conduct further analysis
Keep in mind that a seasonal chart depicts the average price pattern of a stock or index in the course of a calendar year, calculated over several years (unlike a standard price chart that simply shows stock prices over a specific time period). The horizontal axis depicts the time of the year, while the vertical axis shows the level of the seasonal pattern (indexed to 100). The prices reflect end of day prices and do not include daily price fluctuations!
I have highlighted the strong seasonal phase from November 20 to December 6 calculated over the past 15 years. In this time span, of just 11 trading days, the S&P 500 Index rose on average almost 3% and had an astonishing winning strike of 86%
Which Stocks to Pick?
This year, when choosing where to invest, you should consider never-ending supply-chain complications that are still causing delays and shortages among retailers.
During the last year the car industry was heavily impacted. However, the shortage has also affected all kinds of consumer electronics: computers through to tumble dryers, and even items such as electric toothbrushes.
Nevertheless, one stock in particular has been able to overcome all the obstacles during challenging years, namely Lowe’s Companies.
The company has made its mark as the second-largest improvement retailer in the US. Lowe’s main competitive advantage is size and scale, and this affords it superior buying power over smaller rivals.
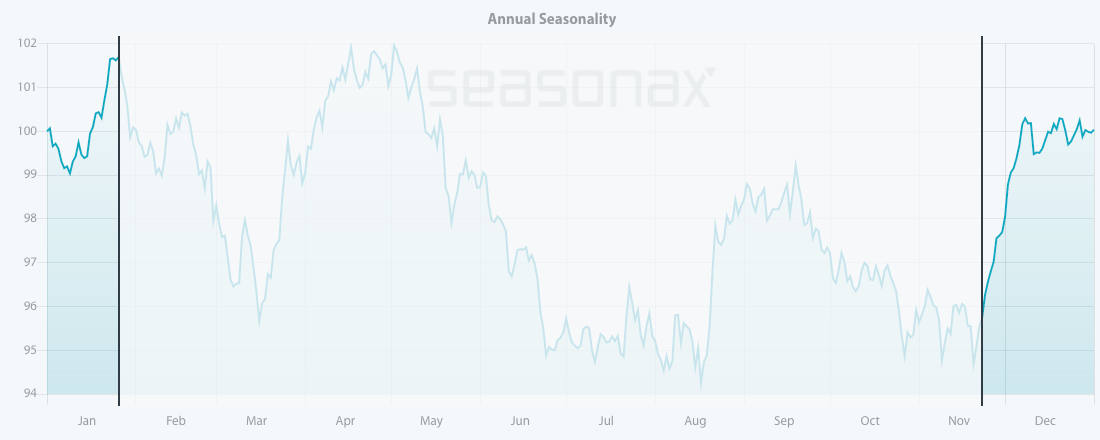
As can be seen on the chart below, the upcoming holidays and Black Friday shopping euphoria are additionally driving the attractiveness of this retailer.
Seasonal Chart of the Lowe’s Corporation over the past 15 years
Source: http://tiny.cc/Seasonax-LowesCompanies to open an interactive chart to conduct further analysis
Historically speaking, the time period from November 20 until December 29 over the past 15 years has been favourable for this company. In this time span of 27 trading days shares rose on average by 7.45%. Moreover, since 2007 the pattern returns had a winning strike of 100%, meaning that Lowe’s generated gains in every single year during the selected time period.
Will this trend be repeated? We will see shortly.
Whilst undoubtedly the holidays are the most important period of the year for retailers, there are also many other stock opportunities among different sectors. Take for instance a stock like UnitedHealth Group. This health care sector stock has very strong seasonals heading into the end of December. Furthermore, when the cost of living bites, health care is one expense that is the last one for consumers to cut back on. This could mean that the groups seasonals have a better chance of weathering stormier economic conditions due to surging US inflation. Will the stock put in another gain this year?
Seasonal Chart of the UnitedHealth Group Inc over the past 15 years
Source: http://tiny.cc/Seasonax-UnitedHealth to open an interactive chart
Another alternative angle to take on the Black Friday sales is the coming World Cup in Qatar. Many consumers will often make TV purchase to enjoy watching the matches on large TV screens. Samsung is one of the world’s biggest TV manufacturers and the stock has profound seasonal tendency during the months of November and December. Will Samsung shares gain even further this year on the back of the World Cup coinciding with Black Friday sales?
Regardless of how Black Friday and other consumer holiday spending shapes up this year, shopping euphoria should eclipse this year’s market rollercoaster for at least a brief moment. Prepare in advance; and make sure to use Seasonax to detect market opportunities ahead.
By signing up for free to https://app.seasonax.com/signup, you will be able to identify the best entry and exit points for more than 25.000+ instruments, including stocks, (crypto)currencies, commodities, and indexes.
Yours sincerely,
Tea Muratovic
Co-Founder and Managing Partner of Seasonax
P.S. This holiday season we are pleased to offer a limited number of 50 lifetime subscriptions to our analytical tool and screener.
Please contact our support team by sending an email to support@seasonax.com for more information.