
Dear Investor,
2020 is drawing to a close. It had a dreadful surprise in store for us with the outbreak of the Corona pandemic, which had a strong impact on financial markets as well.
Furthermore, US presidential elections were held in November. The elections have an effect on stock prices that lasts beyond the day of the election. However, contrary to what many investors believe, prices are not really influenced by the actual outcome of the election.
Rather, what matters to financial markets is which year of the four-year election cycle we find ourselves in. As a matter of fact, the pattern of stock prices barely depend on whether a Republican or a Democrat wins the election. In the past, stock market strength was in evidence under both Democratic and Republican presidents.
The 4-year cycle has a lasting impact on stock markets
Accordingly, the so-called 4-year election cycle phenomenon differentiates not by political party, but by the year of the presidency
In the past 120 years, the Dow Jones Industrial Average (DJIA) on average gained 5.9% in presidential election years. In pre-election years, it did even better, posting a gain of 9.0%. By contrast, in post-election years it rose just 4.5%, and in the subsequent midterm election years just 1.4%.
The 4-year election cycle in detail
But how precisely does the pattern play out? Consider the average four-year pattern of the DJIA over the past 120 years depicted in the chart below. It permits a close look at the patterns within individual calendar years of the cycle as well.
The scale on the right hand side shows returns in percentage terms. The horizontal scale shows the year in the four-year cycle. Thus, above “Election” the average performance of all election years is shown, above “Post-Elect.” that of all post-election years, above “Midterm” that of all mid-term election years, and above “Pre-Election” that of all pre-election years. The strong phases in the election cycle are marked with green arrows, the weak ones with red arrows.
Dow Jones Industrial Average, 4-year cycle over the past 120 years
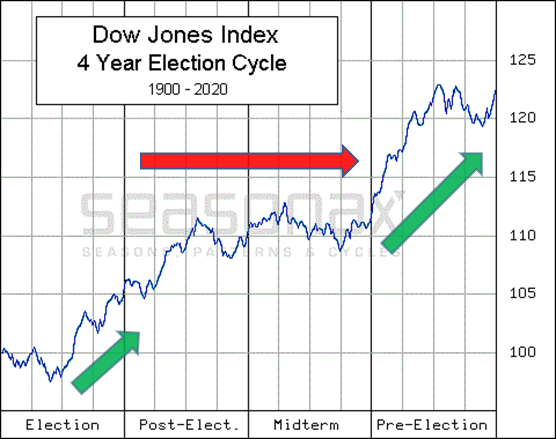
The two years following the US presidential election tend to be difficult.
Source: Seasonax
As you can see from the final value shown on the scale, the average gain over the entire four-year period amounted to a strong 22%. As noted above, the strongest stock market performance was delivered in the election year depicted on the left hand side and the pre-election year on the right hand side.
By contrast, investors reaped almost no gain in the two years in the middle of the chart, the post-election and the mid-term election year.
These two years are currently lying ahead in 2021 and 2022. They threaten to deliver a worse stock market performance than the two preceding years.
Let us now take a closer look at the year of the cycle coming up next, the post-election year.
The typical pattern of post-election years
The second chart depicts the average pattern of post-election years. It is essentially a magnified version of the second quarter of the first chart. It is a filtered seasonal chart that exclusively takes into account post-election year prices.
It shows the average returns generated in the past 30 post-election years. The horizontal axis shows the time of the year, while the vertical axis shows the level of the seasonal index. Thus one can see at a glance how post-election years typically play out.
Dow Jones, typical pattern of post-election years, 1901 to 2017
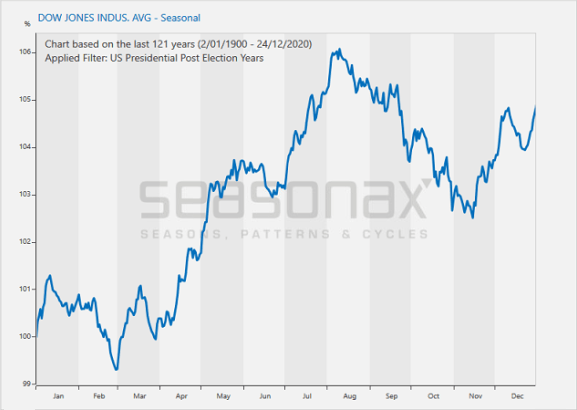
After a weak start, stocks rally until the beginning of August.
Source: Seasonax
As the chart illustrates, share prices basically tend to move sideways in the first three and a half months. However, from mid-April to early August a solid uptrend typically tends to take hold in post-election years. Thereafter fairly pronounced weakness emerges late in the summer, which is followed by a merely moderate rally at the end of the year.
Are there sound fundamental reasons for the typical pattern of the DJIA in the election cycle? If that is the case, it will increase the probability that the pattern can be profitably exploited.
Drivers of the presidential election cycle
How come that returns are weak in the two years after the election, while they are quite strong in the two years preceding the election? The drivers are monetary and fiscal policy: presidents want to be re-elected or want their successor to be a member of their party. Thus they try to stimulate the economy before the election in order to generate positive sentiment among voters. This includes measures financed by deficit spending. Loose fiscal policies tend to provide a boost to financial markets.
The not entirely independent central bank appears to support incumbent presidents through its monetary policy as well.
On the other hand, after the election unpopular measures begin to proliferate, such as e.g. steps intended to limit escalating government debt. This tends to put pressure on stock prices.
Even though it is perhaps difficult to imagine in light of current fiscal deficits in the trillions and ballooning central bank balance sheets: in coming months, there may be less money “printing” than would be the case if an election was lying ahead.
Take advantage of the filter function!
As you can see, with Seasonax you can investigate more than just annual seasonality. If you want to know how e.g. gold or the euro behaves within the four-year cycle, you should call up the filter function at www.seasonax.com right away!
Filter function on Seasonax, with election cycle highlighted
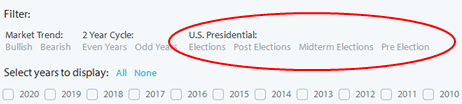
Apart from annual seasonality, you can inter alia examine the typical patterns emerging for gold, the euro or all other instruments in special years such as the post-election year with just a few mouse clicks.
In addition you can also select other types of cycles, or filter out years containing extreme statistical outliers.
Take advantage of this filter function! It can be a very useful addition complementing your seasonal studies.
Yours sincerely,
Dimitri Speck
Founder and Head Analyst of Seasonax