Dear Investor,
Financial markets and seasonality go hand in hand. But do they also correlate in the cold season? Today, I will present to you various fundamentals that have strong influences on stock prices during the last weeks of the year.
Let’s start from the beginning. The Year-end rally, or the so-called ‘Santa rally’, reflects the tendency of US stocks to rally higher around the Christmas holidays. There have been a few explanations for this, including general optimism and good spirits around this time of year.
But is this phenomenon just a myth, or is there something behind it?
The Santa Claus Rally starts in mid-December!
In search of proof, I went far back into history and analysed a seasonal chart of the Dow Jones Industrial Average Index.
DJIA Index, seasonal pattern over the past 124 years
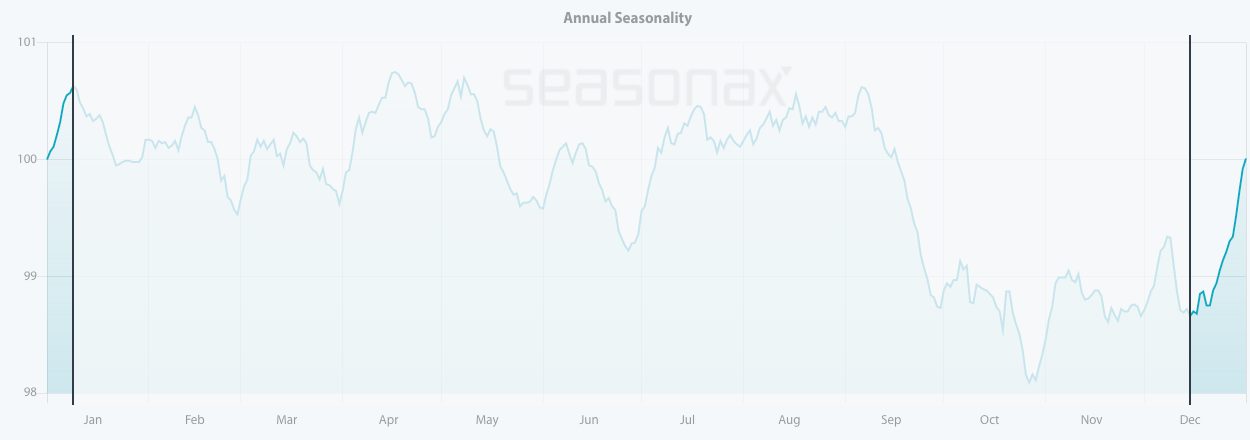
Source: Seasonax By clicking on the link you can conduct further analysis with the help of our interactive charts.
Over the last 124 years, the Santa Claus Rally began on December 15 and typically ended on January 09 of the next year – highlighted in dark blue on the chart.
What is even more astonishing is that the Santa Claus Rally generated an annualized return of 40.98% that was delivered in only 17 trading days.
For comparison: the average annualized gain of the Dow Jones Index during the rest of the time amounted to just 3.16%.
In short, the seasonal rally around the Christmas holidays is quite extraordinary. Plus it can also be seen, in the pattern returns of every single year since 1898, that the prices rose in 77.42% of all cases (meaning that only 28 years out of 124 brought losses during the highlighted period). As the detailed breakdown of the Dow Jones illustrates, blue bars clearly dominate both in frequency and extent.
A myth or the strongest seasonal period of the year?
There have been a few explanations for this seasonal phenomenon.
One often cited reason for the stock market rally at the end of the year is window dressing by investment funds. In other words, investment funds are supporting prices at the year-end in order to embellish their results, with the (purely coincidental but undoubtedly welcome) side-effect of boosting bonus payments, which are often calculated at the turn of the year.
However, although less obvious, psychological reasons are probably more often an important factor. These include the fact that most people tend to take stock at the end of the year and position themselves for the new year. In addition, there is the statistically significant holiday effect, which demonstrably tends to lead to stock market rallies ahead of other holidays as well.
This is a reason we all can relate to, as Christmas shopping and good spirits appear to be spilling over into the stock market as well.
Year-End Rally
Stock that definitely shows strong seasonal tendency during the last two weeks of December is Rio Tinto – one of the three largest mining companies in the world. The stock has a very pronounced year-end effect that even extends to February of the following year.
Looking at the seasonal chart of Rio Tinto, I can conclude that over the past 10 years it has entered into a strong seasonal period from December 14 to February 20. In this time span of 45 trading days, shares rose on average by 13.05%.
Keep in mind that the seasonal chart shows the average price pattern of the stock calculated over the past few years. The horizontal axis shows the time of the year and the vertical axis shows the percentage changes in the value of the stock (indexed to 100).
Seasonal pattern of Rio Tinto over the past 10 years
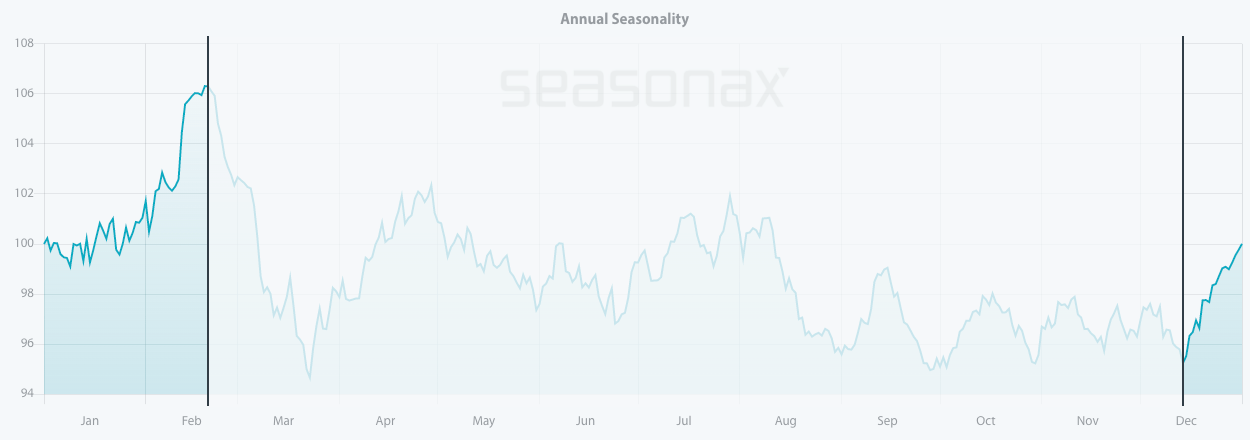
Source: Seasonax by clicking on the chart you will be able to conduct further analysis
Moreover, the pattern returns in this time period have been consistent and positive since 2011, with just one outlier year in 2019, when the stock posted a loss of 7.87% during the period under review.
Pattern return for every year since 2011
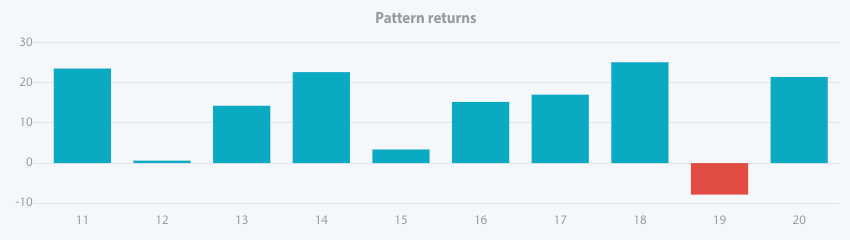
Source: Seasonax by clicking on the chart you will be able to conduct further analysis
It is also interesting to see a very weak seasonal phase that starts from February 21 and lasts until late March. It is in this period in the last 10 years that Rio Tinto has made significant losses.
Weak seasonal period over last 10 years
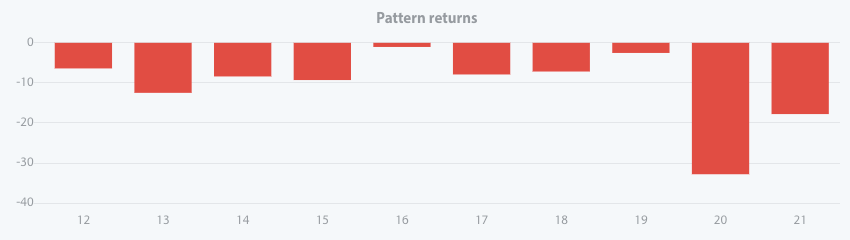
Source: Seasonax
This year no one can tell if strong economic fundamentals, better-than-expected earnings, low capital costs and massive cash will overweigh the current pandemic and supply bottlenecks.
But at least make use of statistical probabilities to increase your return chances, and to identify seasonal weak and strong periods in individual stocks.
Enter the world of seasonal opportunities
To make finding these opportunities even easier, we have launched a Seasonality Screener. The screener is an analytical tool designed to identify trading opportunities with above-average profit potential starting from a specific date. The algorithms behind the screener are based on predictable seasonal patterns that recur almost every calendar year.
Feel free to analyze more than 25.000+ instruments including stocks, (crypto)currencies, commodities, indexes by signing up for a free trial.
Wishing you and your loved ones peace, health, happiness, and prosperity in the coming New Year.
Yours sincerely,
Tea Muratovic
Co-Founder and Managing Partner of Seasonax