Dear Investor,
Novo Nordisk exhibits a brief, but very strong seasonal phase
Take a look at the seasonal chart of Novo Nordisk below. This is not a standard price chart showing prices moves over a specific time period. Rather, the seasonal chart depicts the average price pattern of Novo Nordisk in the course of a calendar year over the past 10 years.
Novo Nordisk, seasonal pattern over the past 10 years
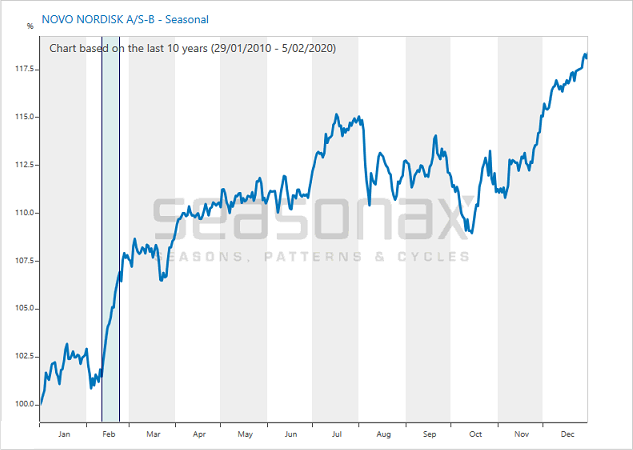
The stock typically rallies particularly strongly in mid February
I have highlighted the especially strong seasonal phase from February 11 to February 22 in blue. In this time period Novo Nordisk displays a particularly strong seasonal advance.
A gain of 495.78 percent annualized!
Over the past 10 years Novo Nordisk rose in every single year in this phase. In other words, the pattern had a hit rate of 100 percent!
The average gain achieved in these mere eight trading days amounted to 5.01 percent. This corresponds to an extremely strong annualized gain of 495.78 percent!
The following bar chart shows the pattern return for the time period February 11 to February 22 in every single year since 2010.
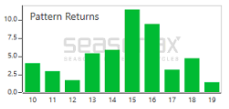
Novo Nordisk, percentage return between Feb. 11 and Feb. 22 in every year since 2010
The stock rallied in every year under review. As this chart confirms, in the past ten years prices indeed rose over these eight trading days in every single year. The largest gain achieved in 2015 amounted to 11.46 percent!
I believe such large seasonal gains in such a short time period represent a phenomenal opportunity. I consider investing in particularly strong seasonal phases and thus significantly increasing the chance of generating extraordinary returns a very appealing idea.