Dear Investor,
As an investor, you may well naturally prefer to think about profit first!
Nevertheless, avoiding losses is just as important, because making up for loss can be difficult.
You are probably familiar with common loss limitation measures, such as diversification or the use of stop losses. At Seasonax, we always advise you to take such measures.
Today, however, I would like to show you how to recognize seasonal patterns that look good at first glance, but are actually bad – and which you should not act on.
106.09% annualized profit – nevertheless no seasonal recommendation.
As an example, I have selected Infineon Technologies, a German semiconductor manufacturer. Take a look at the Seasonax screenshot. The annualized return of 106.09% from March 10 to May 7 is very good over 25 years (see green circle).
Seasonax screenshot, Infineon Technologies
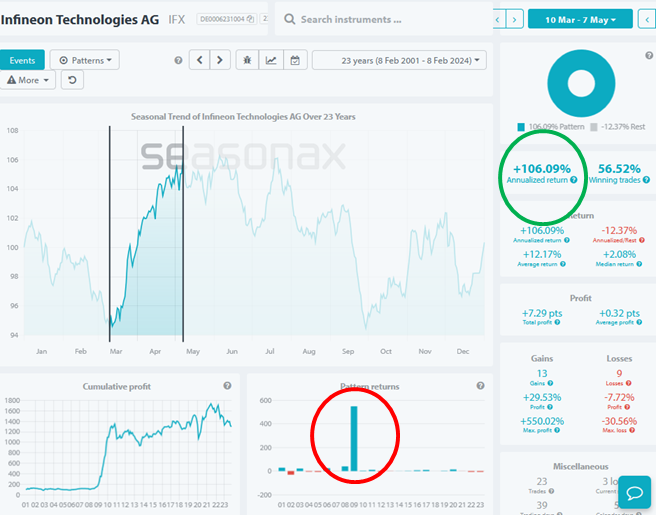
A promising pattern at first glance. Source: Seasonax
But also pay attention to the red circle. It shows you that there was a far supra-regional rise in 2009. In fact, the company was a bankruptcy candidate and penny stock at the beginning of 2009 – the share price was significantly less than one euro. But then things turned around and the share price shot up.
Filter out exceptional years!
However, this increase has nothing to do with seasonality! It would therefore be pointless to rely on it in a seasonal analysis.
To see the seasonal trend without such exceptional years, you can simply filter them out.
To do this, go to “More”, then “All” and then filter out the exceptional year by clicking on it. The next chart shows you the result.
Seasonax screenshot, Infineon Technologies, without 2009
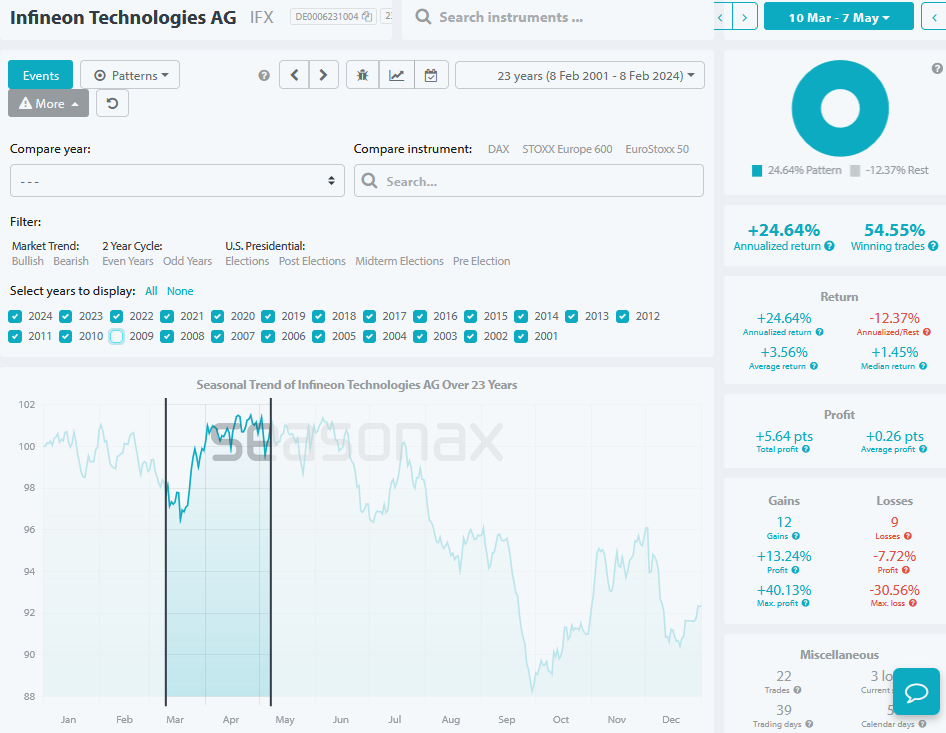
Without the exceptional year, little remains. Source: Seasonax
The increase is now significantly lower. The annualized return without 2009 is indeed only 24.64%, four times less than the original 106.04% figure. There are better seasonal patterns than this.
How to avoid bad seasonal patterns
It is therefore not only the total yield that matters, but also the distribution of the individual yields. The more even the distribution is, the more likely it is to be a genuine seasonal pattern. You can see the distribution in the bar chart “Pattern return”. An even increase under “Cumulative profit” also shows you that the seasonal pattern has recurred year after year. A high hit rate under “winning trades” likewise indicates this.
By looking at the distribution, you can recognize bad seasonal patterns and more effectively avoid losses.
Instead, you can take advantage of good seasonal phases with high yields and relatively even distribution, without outliers!
Best regards,
Dimitri Speck
Founder and chief analyst of Seasonax
PS: Increase your yield probability by avoiding bad seasonal phases!