Dear Investor,
Last year was definitely dramatic: action, comedy and tragedy simultaneously played out in front of our eyes. The Covid Pandemic was, and is, still in the spotlight, influencing every aspect of our lives.
The entertainment industry has stepped up to help us forget our sorrows, and enticed us to the front row by bringing different content to the big screen.
Some content was so strong that it even moved the stock prices of other companies.
In December, for instance, NBC News reported that the fitness equipment company Peloton saw its stock prices fall by 11.3% on the same day that the Sex and the City movie, “And Just Like That,” premiered. A key character, Mr Big, died of a heart attack within the film, after a workout on one of Peloton’s exercise bikes. Prices tumbled to a 19-month low.
A couple of days later, the company posted a commercial to revive its stock prices and to reset the tone.
“Shall we take another ride?”, was the commercial’s key message and also a good intro into 2022.
Entertainment stocks
The fact that one-off events within the media and entertainment industry can have such a strong influence on stock prices is nothing new. However, today I want to show you how you can take advantage of market anomalies that are predictable and reoccurring on a regular basis.
Let’s start with Netflix, a streaming service that has entertained us for years, offering a wide variety of award-winning TV shows, movies, documentaries and more, on thousands of internet-connected devices. Although I am always interested in movie suggestions from my readers, I am even more interested in stock opportunities ahead.
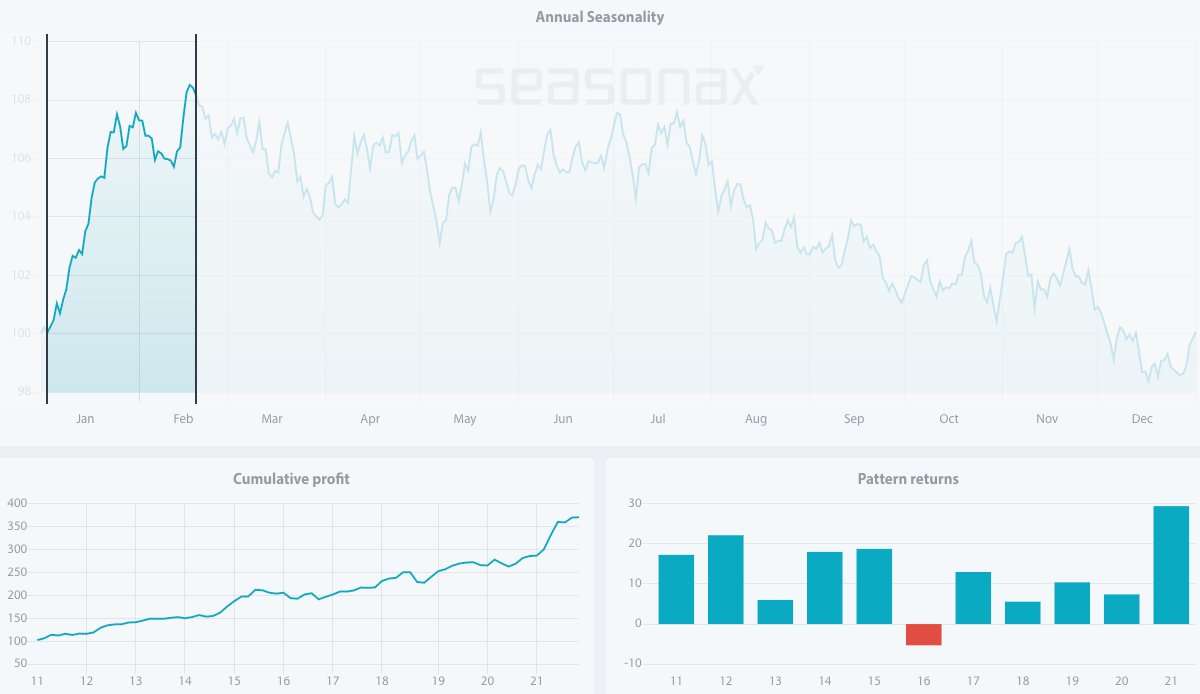
Looking at the seasonal chart of Netflix, I can conclude that over the past 15 years it has entered into a strong seasonal period from January 15 to February 17. In that time span of only 23 trading days, shares rose on average by a spectacular 20.89%.
Seasonal chart of Netflix over the past 15 years
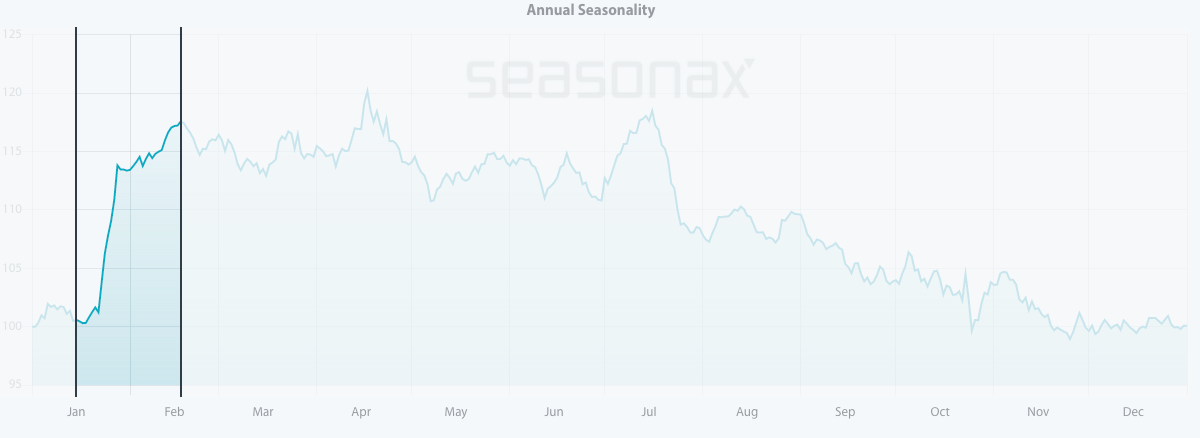
Source: Seasonax – by clicking on the link you will be able to conduct further analysis
Keep in mind that the seasonal chart shows the average price pattern of the stock calculated over the past few years. The horizontal axis shows the time of the year, and the vertical axis shows percentage change in the value of the stock (indexed to 100).
Moreover, the pattern returns in this time frame have been consistent and positive since 2007. There has been just one outlier year during this period, in 2016 when the stock posted a loss of 8.92%.
This year’s seasonal pattern will be strongly influenced by the company’s quarterly report that is to be announced on January 20.
Pattern return for every year since 2007
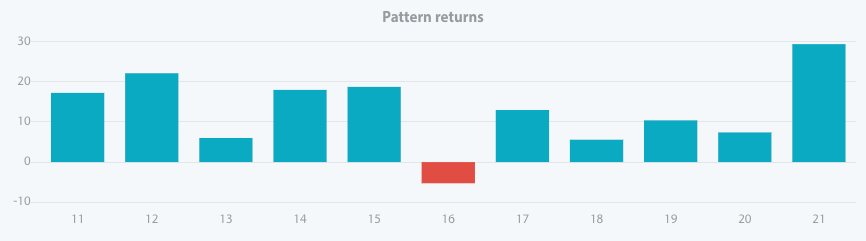
Source: Seasonax – by clicking on the link you will be able to conduct further analysis
Netflix is not the only stock that has kept us well entertained during the last year. There is another example to be mentioned.
Tencent Holdings definitely holds place in the front row as China’s biggest technology and media conglomerate. The company is the world’s largest video game publisher and has its own movie production studios; and as if that wasn’t enough, it also holds stakes in several social media platforms including Snap and Reddit.
In search of a strong seasonal period, I have analysed a seasonal chart of Tencent Holdings. It can easily be seen that over the past 10 years there is a strong seasonal tendency from January 3 to February 19. In this time span of 32 trading days, shares rose on average by 12.15%. Moreover, the pattern returns in that period have been consistent and positive since 2012, with just one outlier year in 2016, as can be seen on the chart below.
Seasonal pattern of Tencent Holdings over the past 10 years
Source: Seasonax – by clicking on the link you will be able to conduct further analysis
We can see with our own eyes that the COVID-19 pandemic accelerated the streaming entertainment trend. However, there is also another fact: demand for entertainment content has historically been relatively resilient, even during periods of economic uncertainty and downturn.
With many ongoing problems, 2022 will still be bumpy, therefore buckle your seat belts and prepare for the ride.
Enter the world of seasonal opportunities
Besides Netflix and Tencent Holdings, there are plenty more entertainment stocks that each have their strong and weak periods: Disney, Amazon.com’s Prime Video, to Apple.
We have launched a Seasonality Screener to make finding these opportunities even easier. The screener is an analytical tool designed to identify trading opportunities with above-average profit potential starting from a specific date. Please also keep in mind that past results and seasonal patterns are no indication of future performance, in particular future market trends.
With that in mind sign up to a free trial and analyze more than 25.000+ instruments including stocks, (crypto)currencies, commodities, indexes.
Yours sincerely,
Tea Muratovic
Co-Founder and Managing Partner of Seasonax