Dear Investor,
Apple is once again back in the spotlight just as its strong summer seasonal pattern approaches. With earnings due after the close on Thursday, July 31 and a critical U.S. tariff deadline on August 1, investors are weighing the company’s management shake‑up as well as the companies AI challenges against this surprisingly bullish seasonal window. Let’s analyze the seasonal data in detail.
- Instrument: Apple Inc. (AAPL)
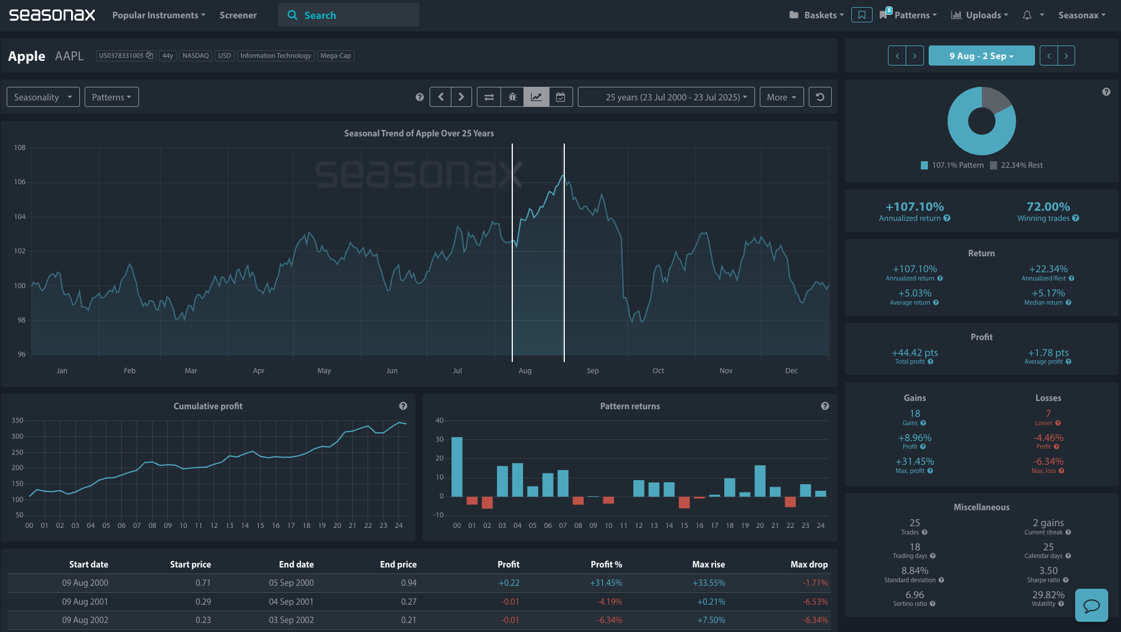
- Average Pattern Move: +5.03%
- Timeframe: 9 August – 2 September
- Winning Percentage: 72.00%
The detrended seasonal chart below shows that over the last 25 years, Apple’s shares have historically delivered an average gain of +5.03% between 9 August and 2 September. They have had a striking 107.10% annualized return and a 72% win rate. Seasonax’s detrended chart is helpful to use as it removes overarching trends from the calculation, showing Apple’s share price climbing into early September. Seasonax’s data shows that this window has produced gains in 18 out of 25 years, with the largest rally in this period hitting a stunning +31.45%.
Macro Cross: Earnings, Tariffs, and a Leadership Shake‑Up
This year’s seasonal window collides with pivotal macro events:
- Earnings after the close on Thursday, July 31: Investors will scrutinize results for iPhone demand, Chinese revenue trends, and any further commentary on supply chain resilience.
- August 1 tariff deadline: With U.S.–China tensions flaring, a new round of tariffs could directly impact Apple’s cost base and margins on China‑assembled devices.
- Management transition: COO Jeff Williams is stepping down, CFO Luca Maestri is transitioning out, and Apple’s design and operations teams are being reshuffled under Tim Cook’s direct oversight. Analysts view this as Apple’s biggest leadership turnover in decades, just as the company faces AI setbacks and regulatory scrutiny.
Despite these headwinds, Apple’s board remains steadfast behind Cook. There is no immediate successor ready, and the company is signaling stability at the top even as it quietly restructures its senior ranks.
Technical Picture: A Pattern Worth Watching
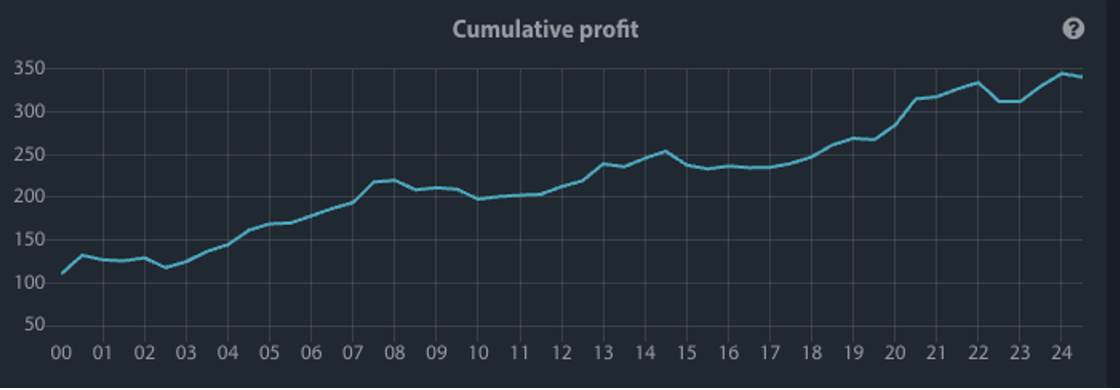
Seasonax’s cumulative profit curve, shown below, trends decisively higher. The cumulative profit curve shows the total profit or loss you would have made if you bought and held Apple during the highlighted time period every single year in the data history. In other words, imagine you repeated the same trade each year in that time window–this number adds up all those results into one cumulative return.
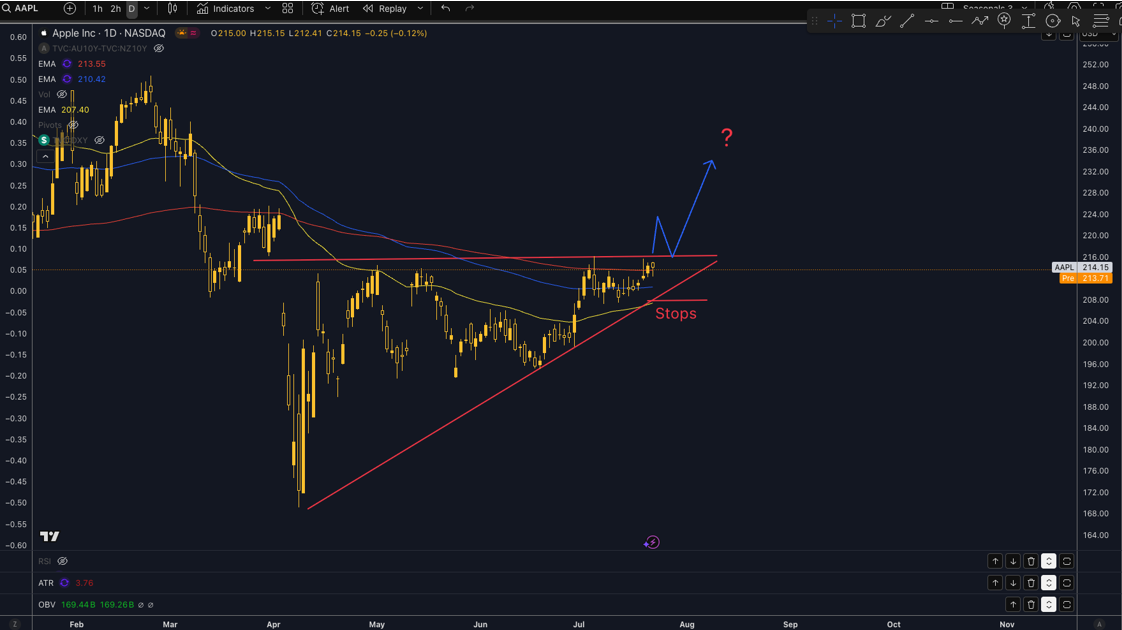
From a technical perspective, the chart below shows price consolidating just beneath a key trend line drawn from April, around the $216 level. A decisive breakout above this area could attract momentum buyers and intraday traders scanning for flag or pennant formations on lower time frames. A daily close above $216 would also place price back above both the 100‑ and 200‑day EMAs, with the added advantage that protective stops could be set fairly tight beneath the lower trend line near $208.
Conclusion: Tread Carefully, But Don’t Ignore the Data
Apple’s seasonal pattern into early September is unusually strong. Yet with earnings on July 31, the August 1 tariff deadline, and ongoing leadership changes, this year’s trade carries more macro risk than usual. Even amid a volatile broader tech landscape, Apple’s historical profile in August suggests a favorable bias – but only if external shocks (like tariffs or weak guidance) don’t derail the pattern. Traders may want to monitor guidance closely and, as always, consider protective stops – but the historical odds for this window remain compelling. Another, more conservative, approach would be to wait for the earnings release and, if positive, look for some intraday moves higher in line with the technical break of 216 and positive seasonal bias. Remember, Apple earnings are due shortly after the close on Thursday July 31 and significant volatility can be expected.
Use Seasonax for your professional handling of market-moving events to find stocks poised to move!
Yours sincerely,
Giles Coghlan, CMT
Macro Strategist Seasonax